
Charting the Rhythm of Finance: Experience the Power of Data Visualization
634 Views
Welcome to the pulsating world where data meets finance! Just like a symphony of sports, gaming, music, and dance, the finance industry harmonizes with data visualization to create a mesmerizing performance.
In this blog, we’ll explore how data visualization, including the use of data visualization WordPress plugins, ignites the stage of finance, unleashing the power to visualize market trends, portfolio performance, risk analysis, and even detect fraud. So grab your front-row seat and get ready for an exhilarating journey through the captivating realm of data visualization in finance!
Market Trends – A Game of Numbers
In the realm of finance, market trends dance to their own beat. Data visualization, powered by WordPress charts and graphs plugins, takes on the role of a seasoned coach, presenting intricate charts and graphs that illuminate market movements. Just as in sports, it helps identify patterns, detect emerging trends, and make informed decisions. With the aid of interactive visualizations offered by data visualization WordPress plugins, investors can effortlessly explore historical data, analyze market indicators, and even predict future trends. It’s like having a crystal ball on the trading floor!
Portfolio Performance – The Symphony of Investments
Managing investments can resemble conducting a symphony. Data visualization, with the help of WordPress charts and graphs plugins, allows investors to see their portfolios as a melodic composition, with each asset playing its unique tune. Interactive dashboards and performance charts harmonize disparate data, allowing investors to monitor their investments in real-time. With the rhythm of data visualization in WordPress, investors can adjust their strategies, balance their portfolios, and fine-tune their financial symphony to create a harmonious, profitable masterpiece.
Risk Analysis – The Dance of Caution
In the finance industry, risk analysis is the dance of caution, and data visualization in WordPress provides the choreography. Just as dancers must be nimble and agile, financial professionals must navigate risks with precision. Visualizing risk metrics and scenarios using WordPress charts and graphs plugins helps to assess potential threats, understand the impact of market fluctuations, and make informed risk management decisions. Interactive heatmaps and risk visualization tools become the dance floor where risks are identified, evaluated, and gracefully managed.
Fraud Detection – The Melody of Integrity
Fraud detection in finance requires an ear for irregularities, just like music enthusiasts can detect even the subtlest off-key notes. Data visualization, with the aid of data visualization WordPress plugins, acts as a conductor, orchestrating a harmonious composition of data points to identify fraudulent patterns. By analyzing large volumes of financial transactions, visualization techniques can unveil suspicious activities, anomalies, and potential fraud hotspots. It’s like catching the rogue notes that disrupt the symphony of financial integrity.
Predictive Analytics – The Game-Changing Playbook

In the fast-paced world of finance, predictive analytics acts as the game-changing playbook that can tilt the odds in your favor. Just as strategic gaming decisions can lead to victory, data visualization empowered by WordPress charts and graphs plugins, empowers financial professionals to anticipate market movements and make proactive decisions. By leveraging historical data and advanced algorithms, visualizations can forecast future trends, simulate what-if scenarios, and guide investors towards well-informed strategies. It’s like having a secret weapon that puts you ahead of the game.
Visualizing Financial Performance – The Concert of Success
In the grand concert of financial performance, data visualization in WordPress takes center stage, transforming complex financial data into a captivating symphony of insights. Just as music notation brings melodies to life, financial dashboards and charts powered by WordPress charts and graphs plugins transform raw numbers into meaningful visual representations.
With interactive visualizations, stakeholders can effortlessly track key performance indicators, monitor financial metrics, and gain a holistic view of the organization’s financial health. It’s like attending a concert where financial success resonates through every note, leaving audiences inspired and informed.
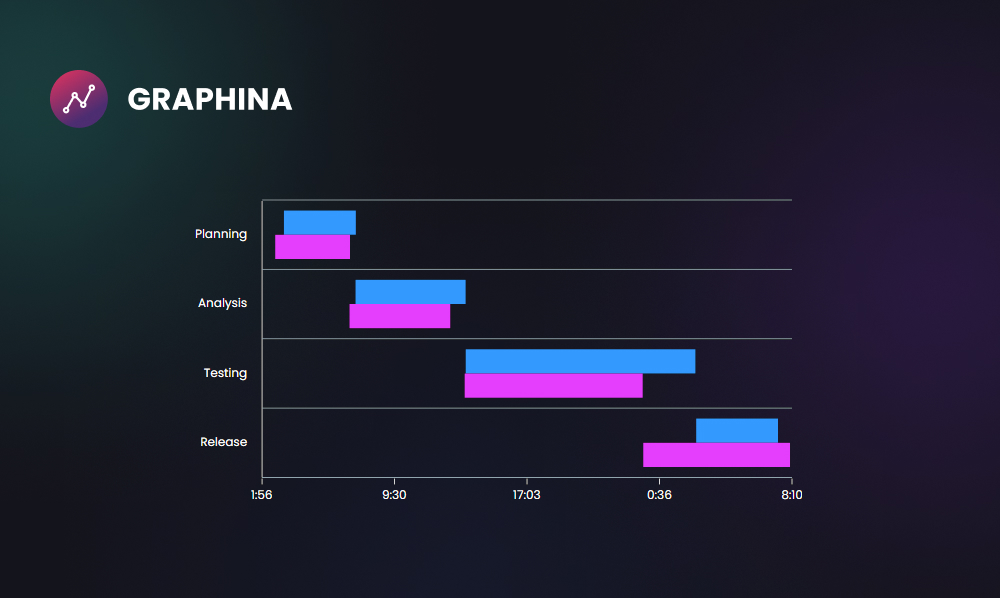
The Power of Graphina Pro – Your Data Visualization King!
In the captivating world of finance, where data visualization sets the stage ablaze, Graphina Pro emerges as the ultimate conductor of visual storytelling. With its seamless integration into WordPress and the ability to create dynamic graphs and charts.
Graphina Pro becomes the cornerstone of your data visualization symphony. Just like a master composer, this powerful WordPress charts and graphs plugin harmonizes with your financial data, transforming it into mesmerizing visual narratives that reveal market trends, showcase portfolio performance, analyze risks, and safeguard against fraud. With Graphina Pro, you hold the game-changing playbook that empowers you to predict the future and visualize financial success.
So, step into the spotlight, and let Graphina Pro unleash the rhythm of data visualization in WordPress, allowing you to chart your course towards triumph and create a symphony of financial insights like never before.
Conclusion – The Last Act
As the curtains draw to a close, we have witnessed the transformative power of data visualization, including data visualization WordPress plugins, in the dynamic realm of finance. From uncovering market trends to managing portfolios, from analyzing risks to detecting fraud, from predictive analytics to visualizing financial performance, data visualization has proved to be the ultimate instrument of success.
Just as sports, gaming, music, and dance captivate our senses, data visualization in WordPress infuses excitement, creativity, and clarity into the world of finance. So, embrace the power of data visualization in WordPress and unlock the full potential of dynamic graphs and charts with Graphina Pro, the most powerful charting solution that integrates seamlessly into WordPress. Let your financial journey become a mesmerizing spectacle, guided by the rhythmic and trend-setting power of data visualization in WordPress.
Now, step into the spotlight, and let data visualization in WordPress orchestrate your path towards financial triumph. The stage is set, the audience is waiting, and it’s time to make your mark in the symphony of finance!
Was this article helpful?
YesNo


