
How to Create Charts and Graphs in WordPress
861 Views
Is there a better approach to analyze data, the link between various data points, and the change in value over time than through the use of charts and graphs? When it comes to making something as dry and boring as numbers more approachable, nothing beats a clean visual representation.
What’s more, you won’t have to deal with complicated graph-building tools because WordPress graphs and charts are created with Best Free WordPress Plugins. As a result, we’re here to show you which plugins are the best, as well as How to Create Charts and Graphs which are useful for WordPress for reporting and infographic WordPress themes.
Why WordPress Plugins?
You might be wondering why you couldn’t just create a graph or chart in, say, Excel and then screenshot it to include relatively. This strategy can work well in some cases, but it can also be a major waste of time. When you need advanced functionality that isn’t available through a WordPress plugin, you should use Excel or another chart-building tool.
Otherwise, here are some of the advantages of using plugins to create the Best Free WordPress Plugins for charts and graphs:
- It collects all of your graph creation into one place. You will save a lot of time if you generate graphs or charts on a regular basis.
- You can go back and make changes to the graph if necessary. An image limits quick fixes and involves the retrieval of an old file used to create the graph.
- Interactive features are available in some charts and graphs that would not be possible with an image.
Overall, the best WordPress chart plugin free, makes the process easier while still providing you with the majority of the functionality you’ll need.
How to Create Charts and Graphs in WordPress?
We’ll concentrate on the one that allows you to generate graphs in this article. Because there are so many amazing things you can do with it, we decided to show you how to make amazing graphs, which you can see on the addon’s page.
Introducing Graphina: Free Elementor Charts and Graphs

Graphina is a free Elementor charts and graphs plugin that generates a variety of different charts and graphs. Viewers and presenters often disagree with having to process a large amount of data. For a site owner, data consumption and visualization are absolutely necessary. The WordPress chart plugin free can make things a whole lot easier and more attractive.
The stunning Graphina – best WordPress chart plugin free is a free tool for developers who want to present data in the most pleasing possible way. Free Elementor charts and graphs plugin allows website developers to create a variety of graphs and charts that are best suited for the website.
Create various chart styles with over 100 elements, 13 distinct chart types with over 50 cumulative variations – all simply adaptable to any site page.
Graphina – free Elementor charts and graphs to brand by data-driven information in smart, data visualization-friendly charts and graphs – is now available for download. This WordPress chart plugin free is also simple to use for non-developers who have no coding experience.
The user’s Elementor site interface can be used to add the appropriate quantity of data, update the grid display, change the colors to their preference, and define fonts, padding, and margins for elements.
Advantages to Have Graphina – WordPress Chart Plugin Free
- In only a few clicks, Graphina – best wordpress chart plugin free can turn statics into a variety of chart styles and graphs.
- Each chart created with Graphina is dynamic, animated, and elegantly displayed.
- Graphina – WordPress chart plugin free is a lightweight and user-friendly charting library, unlike other complex and bulky charting libraries.
- Graphina – Free Elementor Charts and Graphs is a chart and data visualization framework that enables users to embed charts into articles without requiring any technical knowledge.
Introducing Graphina Pro: Elementor Dynamic Charts, Graphs, and Datatables

Elementor Dynamic Charts, Graphs, and Datatables – GraphinaPro plugin should be a must for WordPress sites. GraphinaPro can build attractive charts and graphs with an easy-to-customize, data integration-enabled style as the best Data Visualization WordPress Plugin.
GraphinaPro – Tables and charts WordPress plugin transform raw data into useful data visualization elements, allowing site visitors or clients to see the data in the most attractive possible way. Each graph template in this Elementor Dynamic Charts Graphs and Datatables collection has been professionally developed to attract a wider audience and potential visitors.
For modern data-driven sites, GraphinaPro is a WordPress plugin for Apex charts, Elementor charts, and graphs. To update the ready-to-use graph and chart templates in GraphinaPro, users can select from a variety of stylish fonts and bold color palettes.
To attract more attention, establish or relaunch a website/blog with modern, innovative, and extremely engaging charts and graphs.
Elementor Dynamic Charts, Graphics, and Datatables will automatically populate graphs with data. Use the smart integration of GrahinaPro – Best Data Visualization WordPress Plugin. Simply copy and paste the data from an Excel sheet or a CSV file into it.
Advantages to Have Graphina Pro – Best Data Visualization WordPress Plugin
- Elementor Dynamic Charts on GraphinaPro By importing data on the site in a few clicks, Graphs and Datatables promise hassle-free chart and graph production.
- GraphinaPro, the greatest Data Visualization WordPress plugin, allows you to quickly switch between different types of graphs and charts to meet your needs and present data in the best way possible.
- Tables and Charts with GraphinaPro – Best Data Visualization WordPress plugin can customize the brand with custom colors and gradients to meet the blog or website’s needs.
- GraphinaPro’s charts and graphs are interactive, with smooth animation and many legend positioning possibilities.
- With the Elementor Dynamic Charts, Graphs, and Datatables plugin, visualizing complex data has never been easier or more effective.
How to Create Charts and Graphs in WordPress Using Graphina – Free Elementor Charts and Graphs
Graphina is one of the best and most user-friendly WordPress plugins for creating tables, charts, and graphs. Here, we’ll explain the process of building visually beautiful charts and graphs and displaying them on the front end of your website.
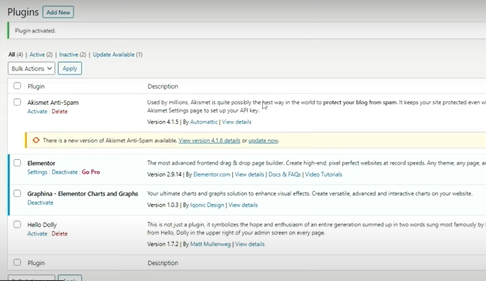
Step 1: Install and activate the plugin

The first step is to download and install the Graphina – Free Elementor Charts and Graphs plugin for WordPress. You may do this easily from the admin panel by going to Plugins > Add New, as this is a free plugin. Click the Activate button after you’ve installed the plugin. You’ll see that Graphina has been added as a new menu item to the sidebar menu.
Step 2: Add a New Chart
To access the Graphina Library, go to the Graphina menu item in the admin panel after installing the Graphina – WordPress chart plugin free plugin. To begin generating your first chart, click the Add New option from here. You’ll see a variety of chart types from which to choose.
Step 3: Import Data Into the Chart
You’ll import data and add it to your table, chart, or graph in this step.
Step 4: Customize the Chart

You can now customize your table, chart, or graph after you’ve chosen a chart type and imported your dataset. Here’s how to do it:
In the data import options section of the same screen, you’ll find Advanced functionality choices. To see the customization options for the chart type you selected, click the link.
Charts Widgets in Graphina: Free Elementor Charts and Graphs for WordPress
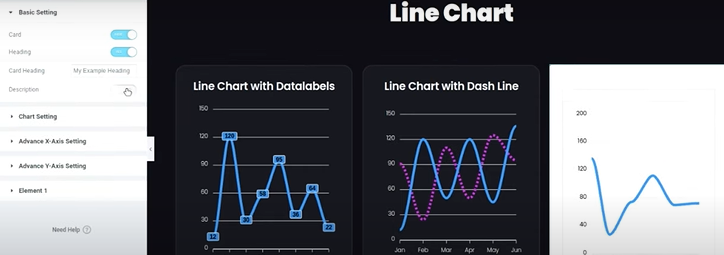
Line Chart

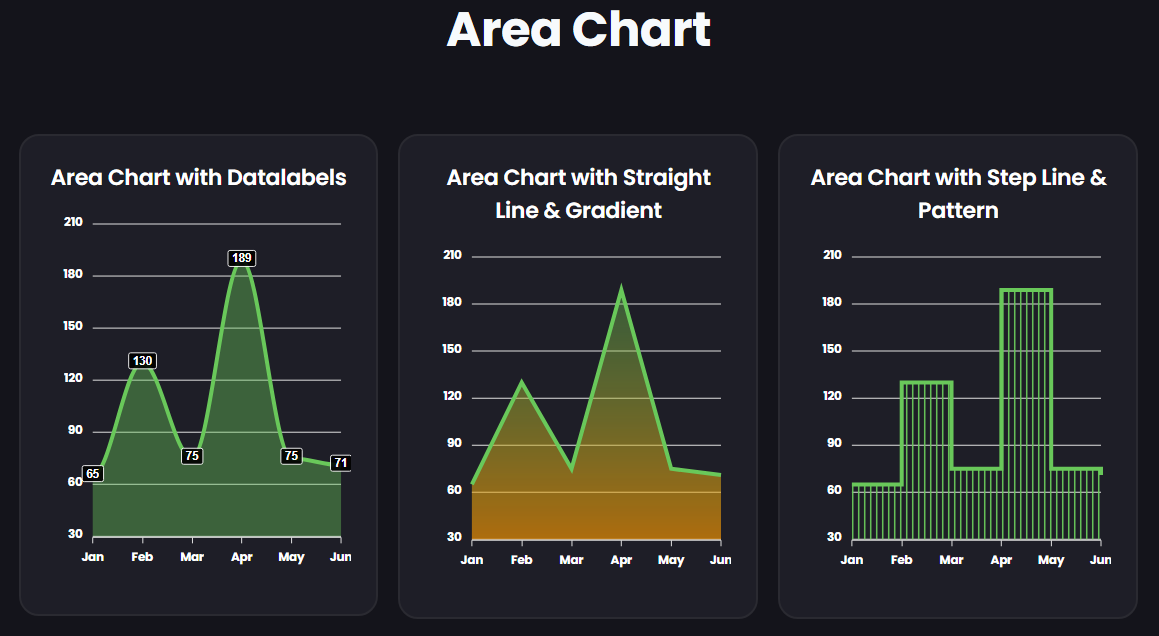
Area Chart
Column Chart

Bubble Chart

Timeline Chart

Radial Chart

Radar Chart

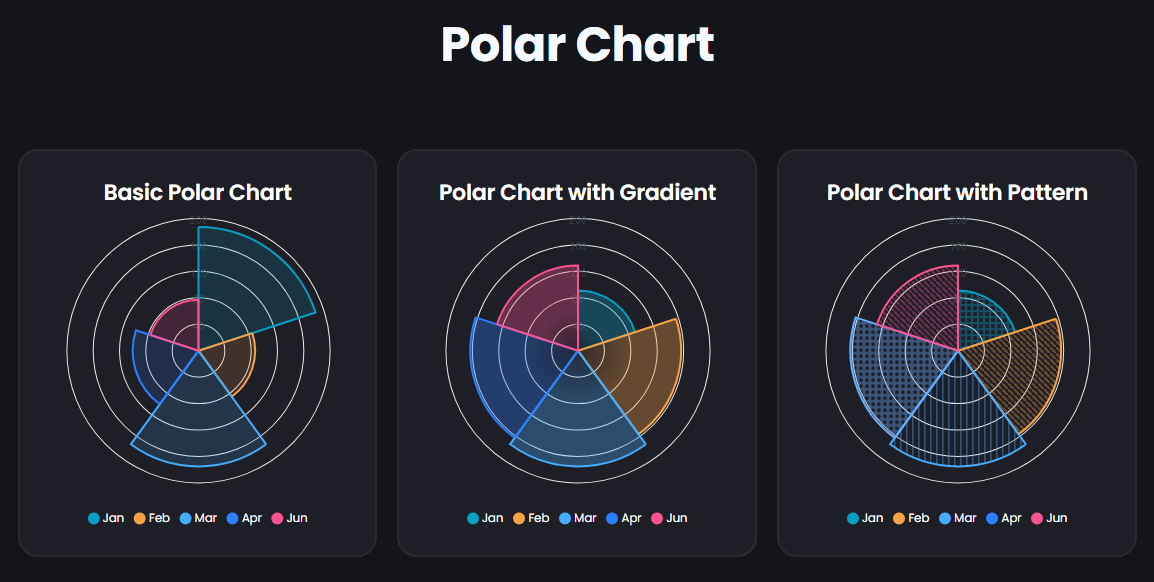
Polar Chart
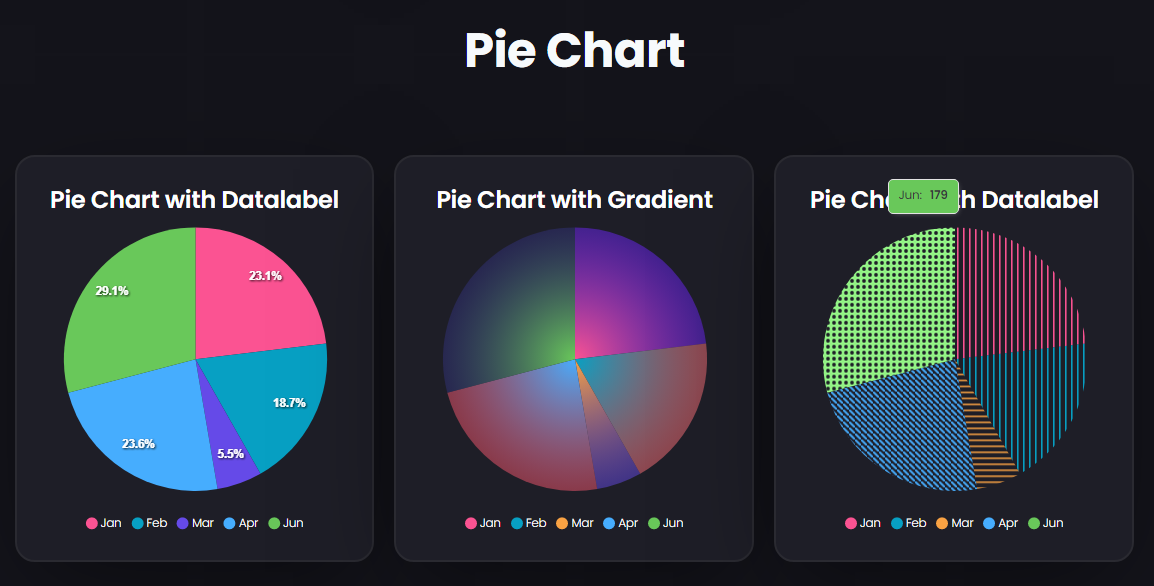
Pie Chart
Nested Column Chart

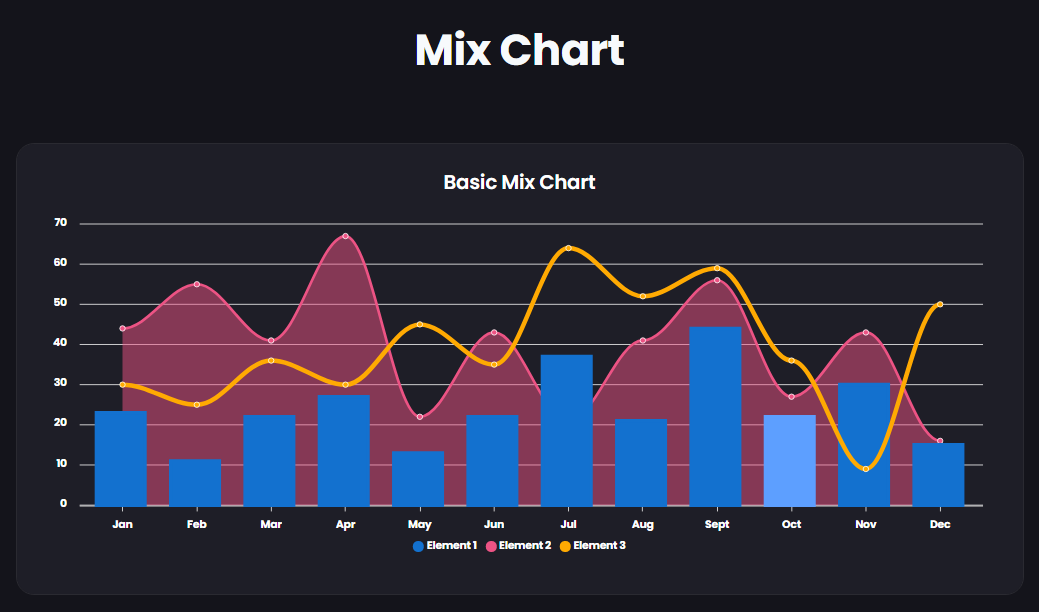
Mixed Chart
Heatmap Chart

Donut Chart

Candle Chart

Charts Widgets in Graphina Pro: Elementor Dynamic Charts Graphs and Datatables
Dynamic Charts

Dynamic Datatables

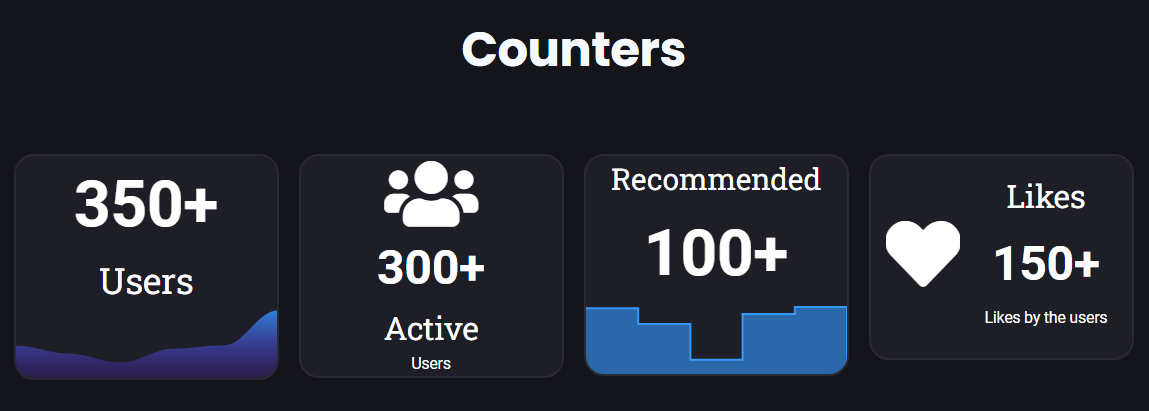
Dynamic Counters
View Restrictions
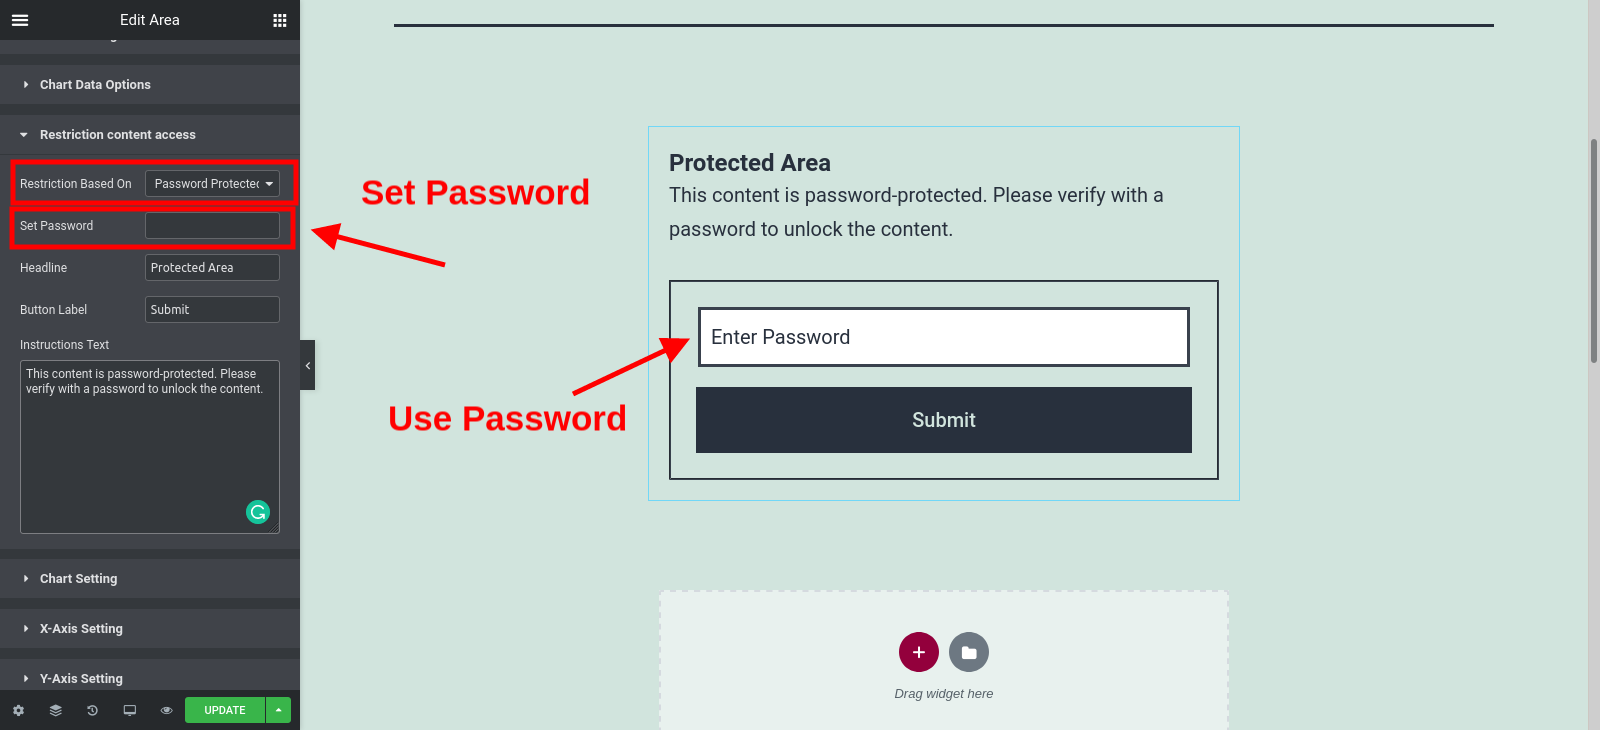
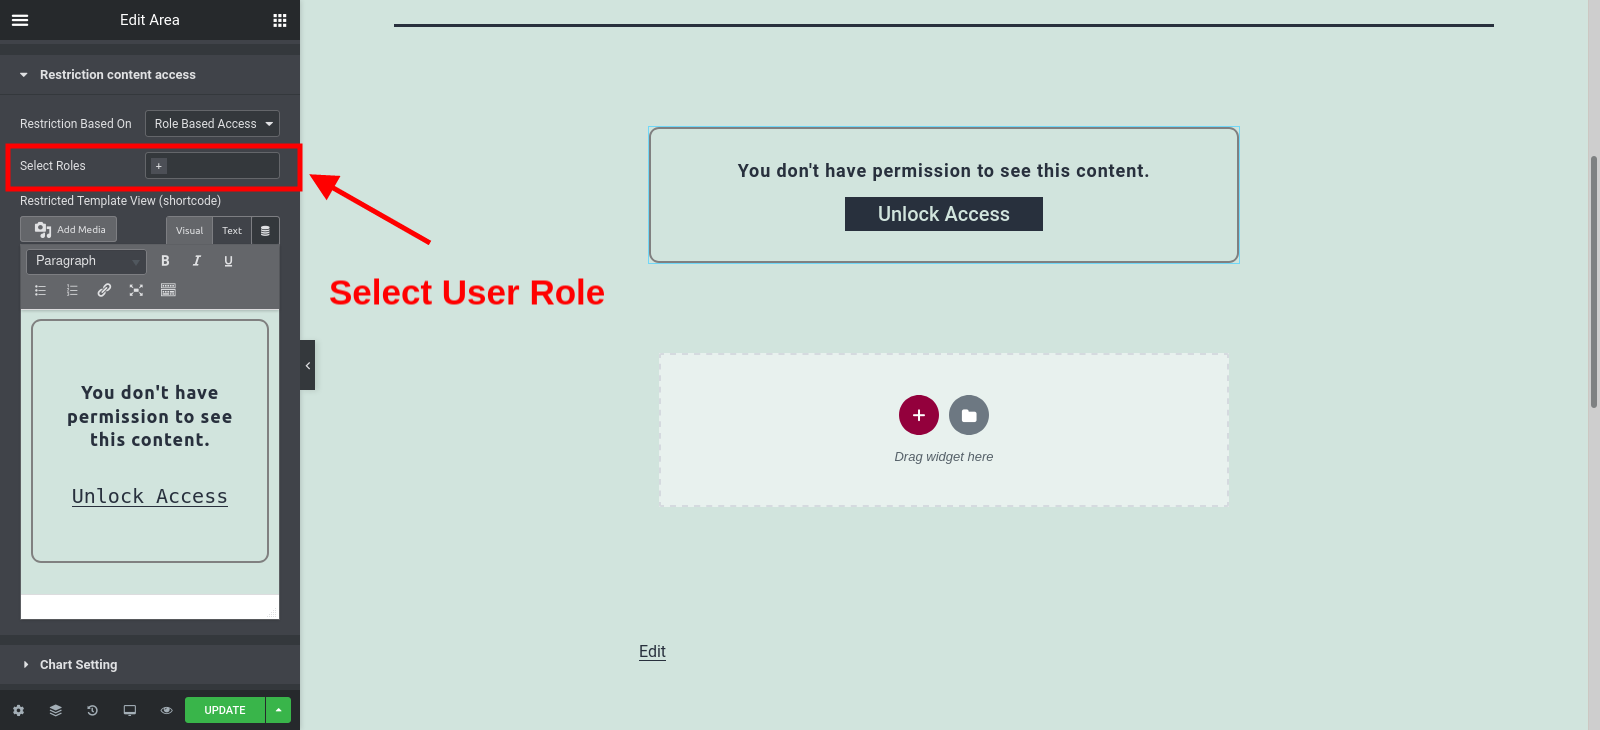
The chart’s view restriction can be configured in a variety of ways. The following settings can be used to set view restrictions.

The user can check whether or not he or she is logged in to the system. Otherwise, they see the approved person’s alternate perspective.
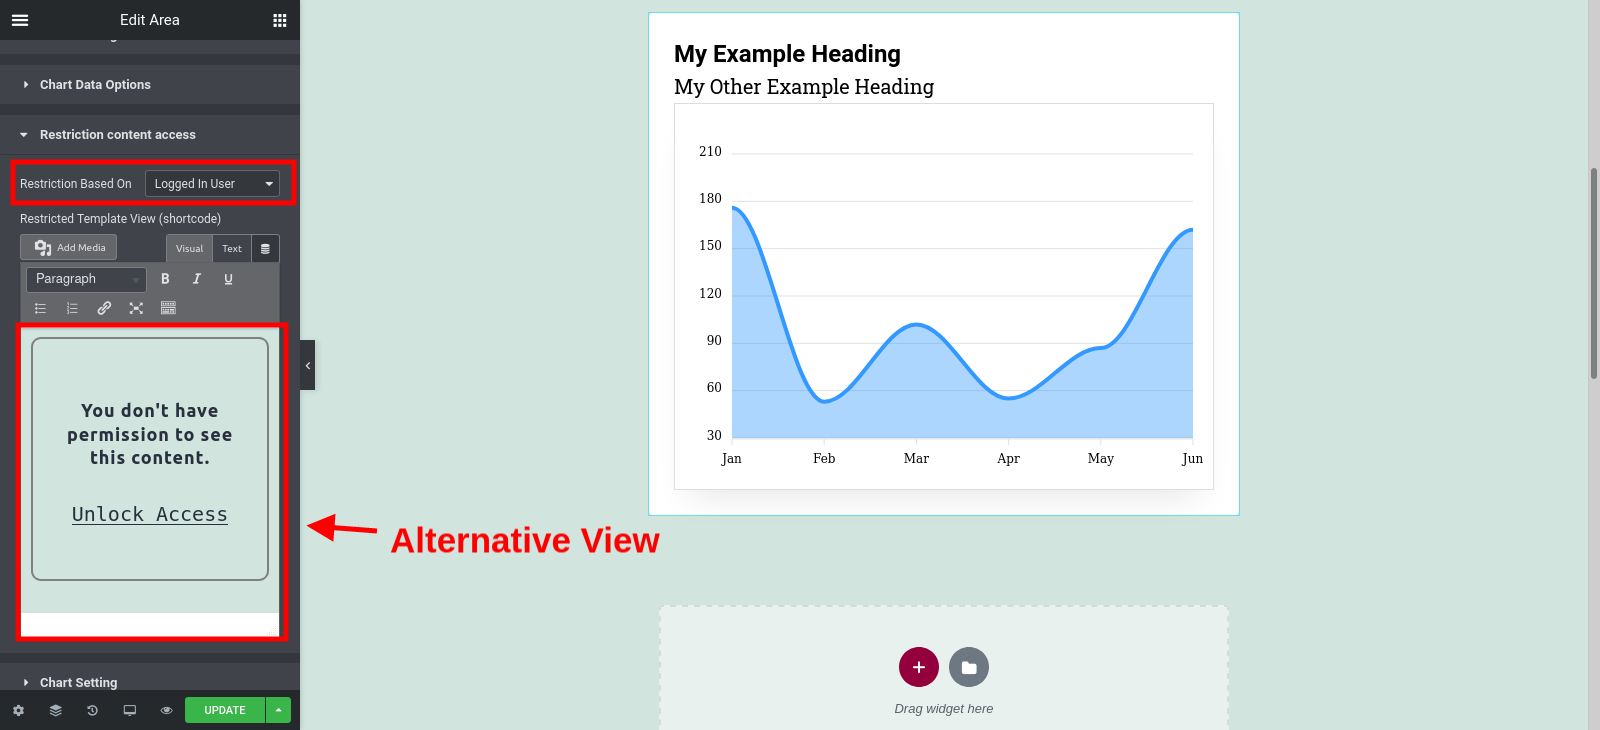
After providing the right password specified by the authorized person, the user will be able to view the content.
Only users with specific roles will be able to see the content. Otherwise, the user will see a different type of content.
Bottom Line
I highly urge you to explore the charts and graphs plugins described in this article; I am confident you will be pleasantly surprised by how simple they are to use. Each chart and graph in WordPress has its own set of features.
The great thing about these plugins is that they provide you complete control. As a result, I recommend that you spend some time analyzing your graphs and understand what each setting variation means. Then you’ll become a chart expert, and everyone will want to know how you do it.
Leave a comment below if you have any queries or suggestions about how to create WordPress charts and graphs.
Subscribe to our newsletter for the latest themes, templates and tools to let you build a successful web project without painstakingly dealing with coding skills.
Subscribe to our YouTube channel for quick video tutorials and follow us on Facebook and Instagram for quick tips, educational posts, infographics and lot more.
Was this article helpful?
YesNo


