
How To Turn Google Sheet Data into WordPress Charts Using Graphina
679 Views
Turn Your Google Spreadsheet Into A Chart Using Graphina. Now I will start this blog with a question! Have you ever thought of having a plugin that would assist you in creating your abstract number into an understandable form at first glance? Keeping that in mind we have come up with this Best Data visualization plugin for the community.
Graphina provides multiple source options for turning your static data into dynamic data. The multiple sources that Graphina supports are SQL builders, Google sheets, Rest API, and many more.
Out of those multiple sources in this blog, we will learn how to turn your google sheet data into WordPress charts and graphs using one of the best data visualization plugins – Graphina.
Graphina offers 15+ types of charts and graphs, 1000+ variations, and 100+ customization options. Using these high-tech features to their utmost level you will gain the following benefits –
- Data-Driven
- User-Friendly
- No coding Knowledge Required
- Multiple Google Fonts
- Real-time Customization
Following are the steps for Google spreadsheet to WordPress chart conversion Using Graphina- Best Data visualization Plugin.
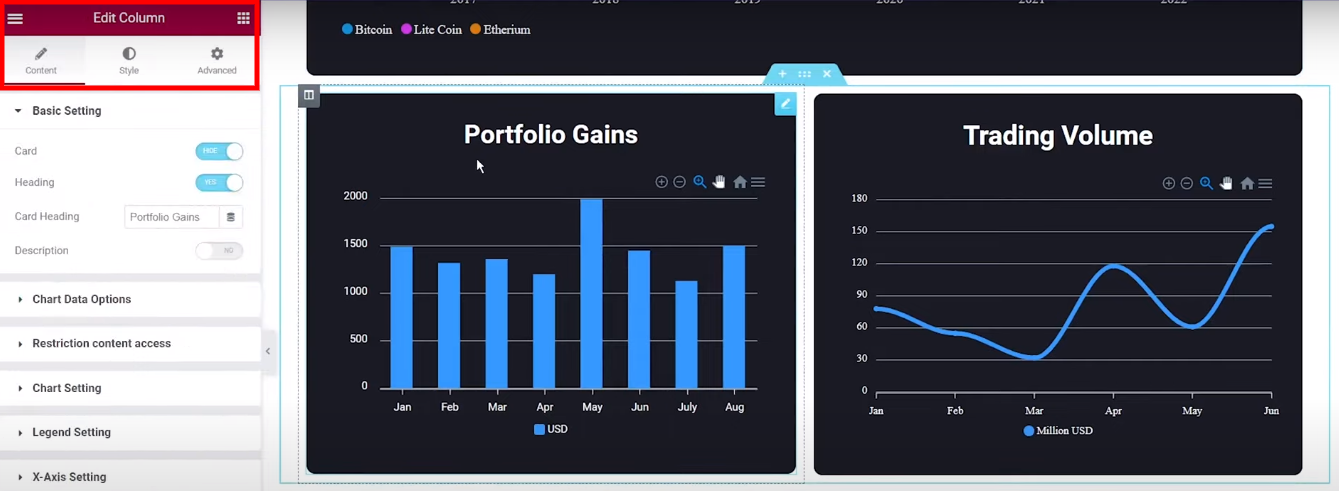
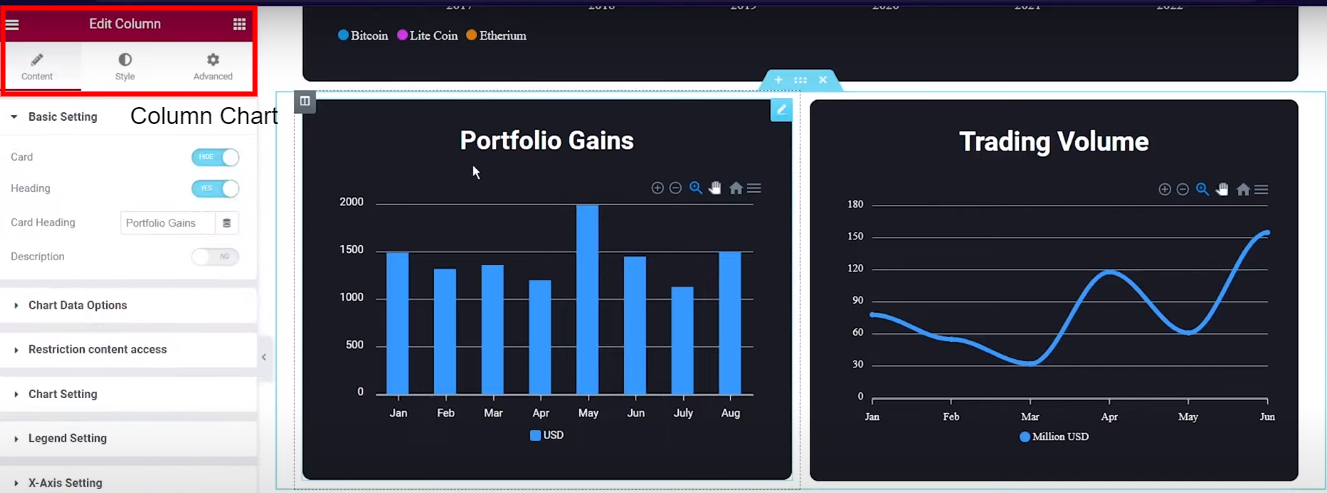
Step 1:-
Firstly Open the Graphina and then Select the chart. For example, I have taken the column chart in the above image.
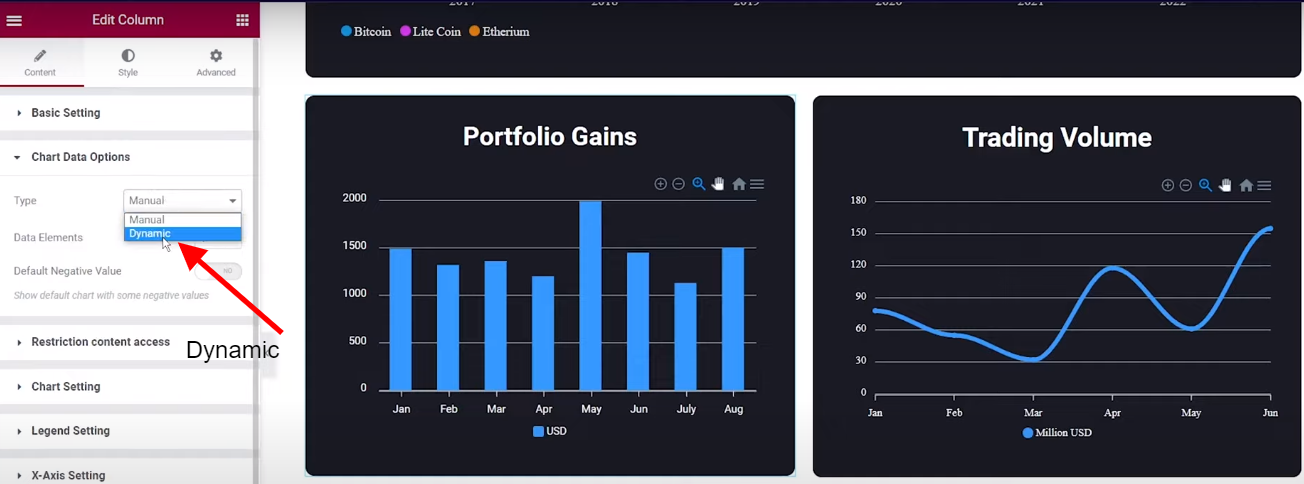
Step 2:-
Firstly go to the chart data option, and then select the dynamic data option other than manual.
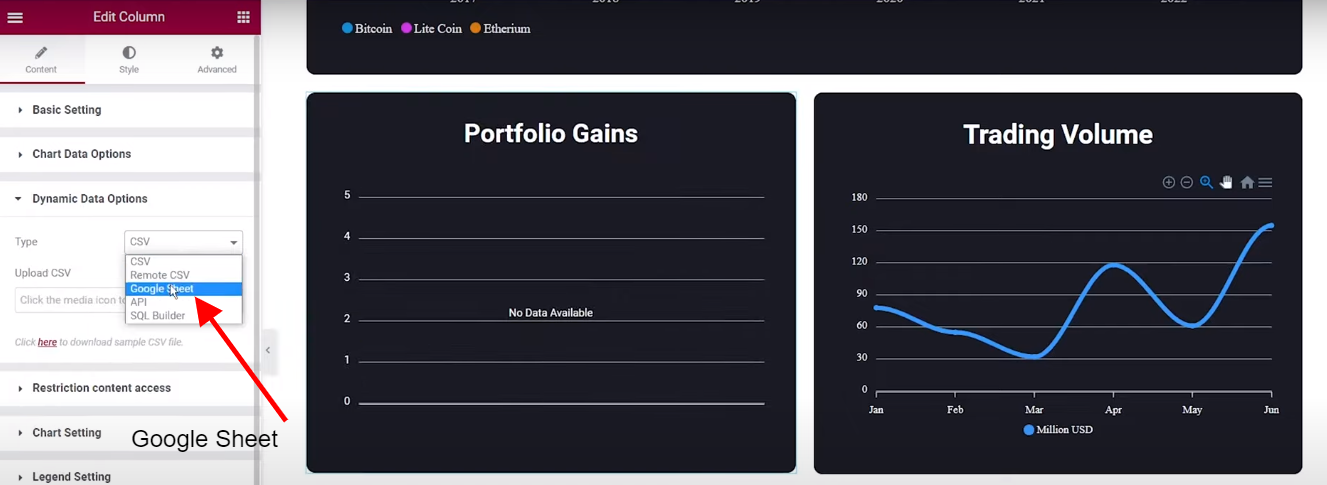
Step 3:-
Now go to the Dynamic Data Option and then select the Google sheets.
Step 4:-
Now we will go to the Google sheet, as I have already made a Google sheet as an example.
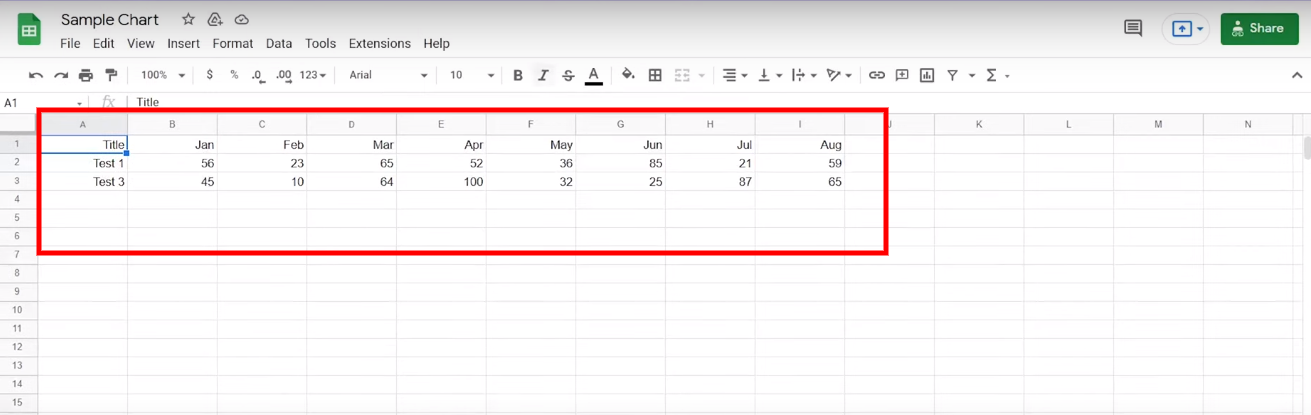
Step 5:-
Drag your cursor to the file and then click on it.
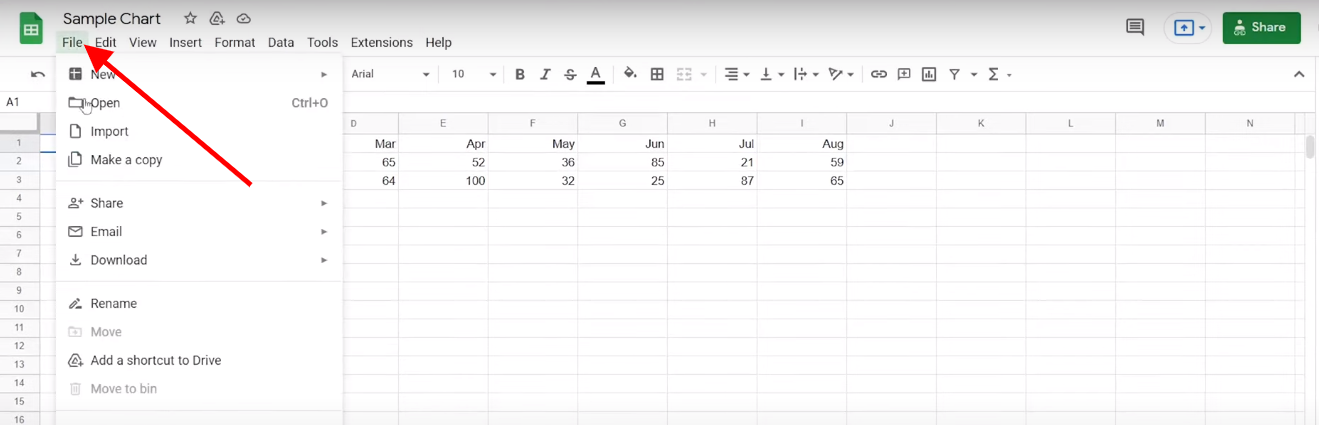
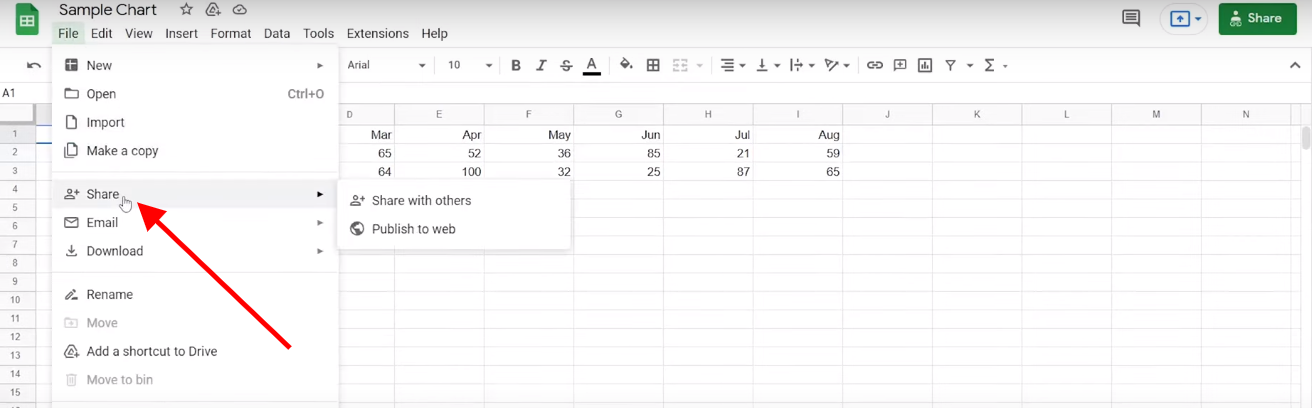
Step 6:-
After going to share you will see two options that are shared with others and published on the web.
Step 7:-
Click on Publish to the web.
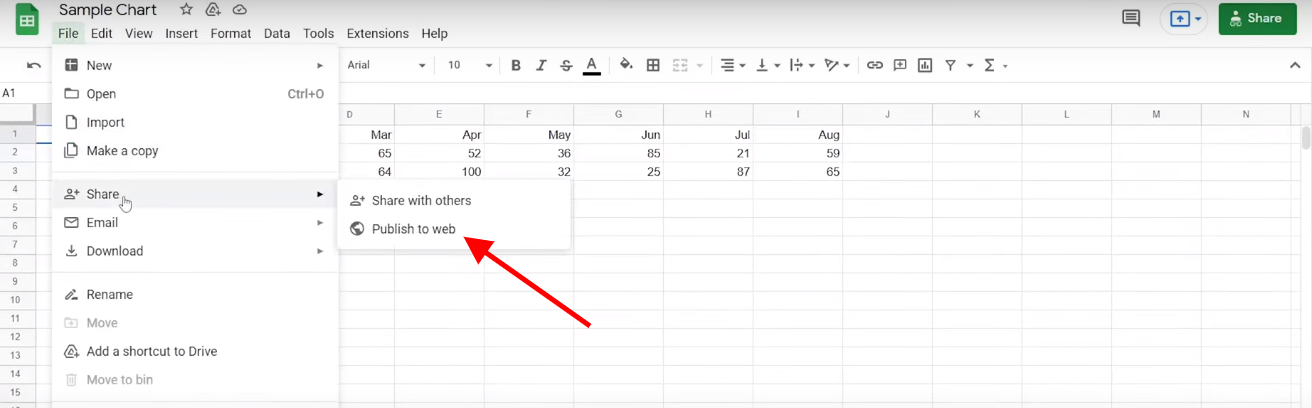
After clicking on Publish you will see the multiple options on how to embed your link for conversion.
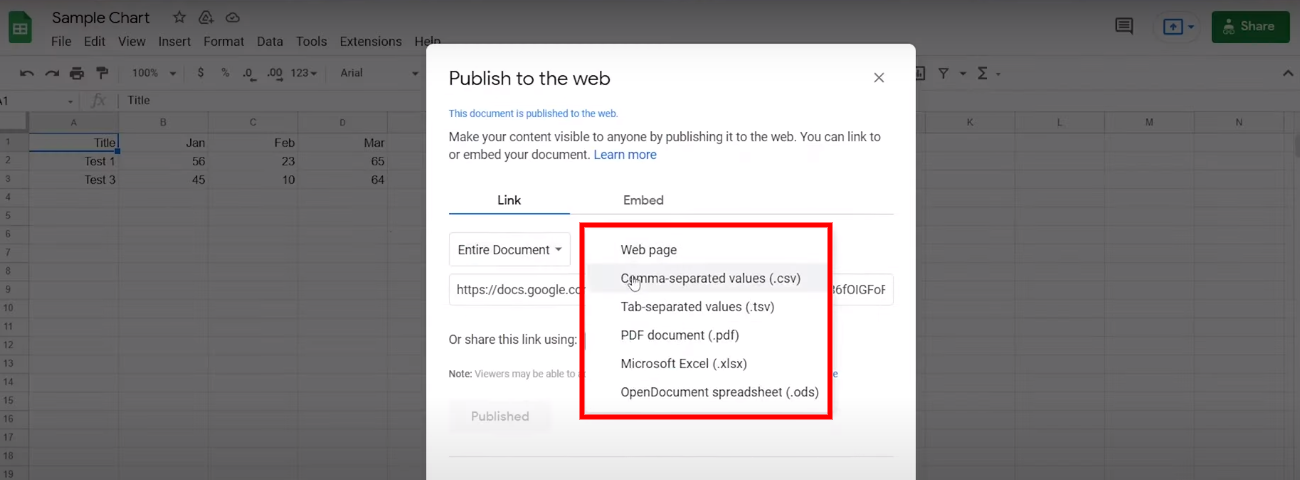
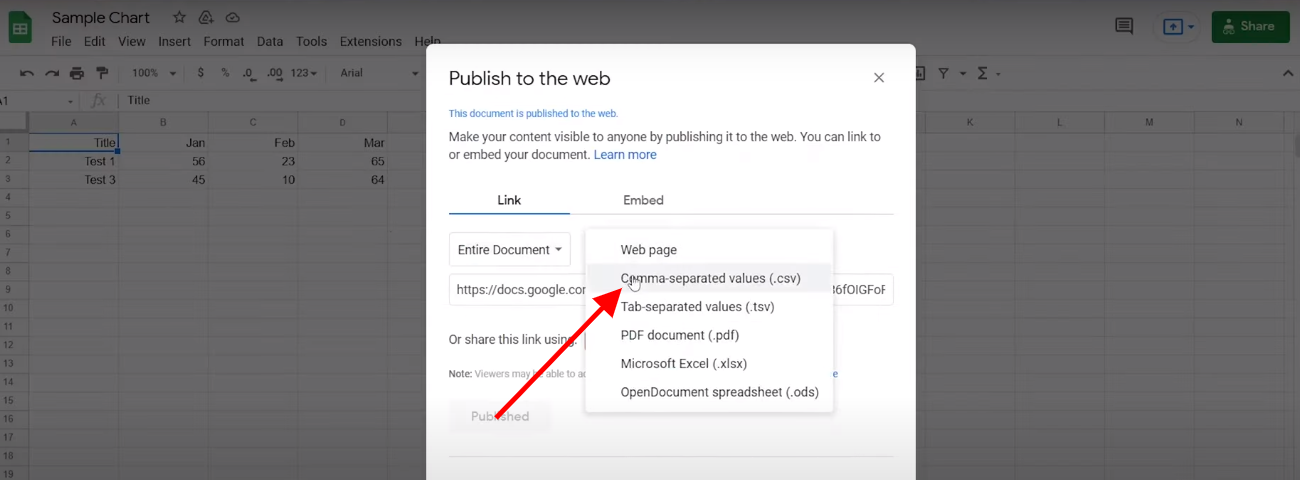
Step 8:-
Then select the Comma-Separated-Values (CSV).
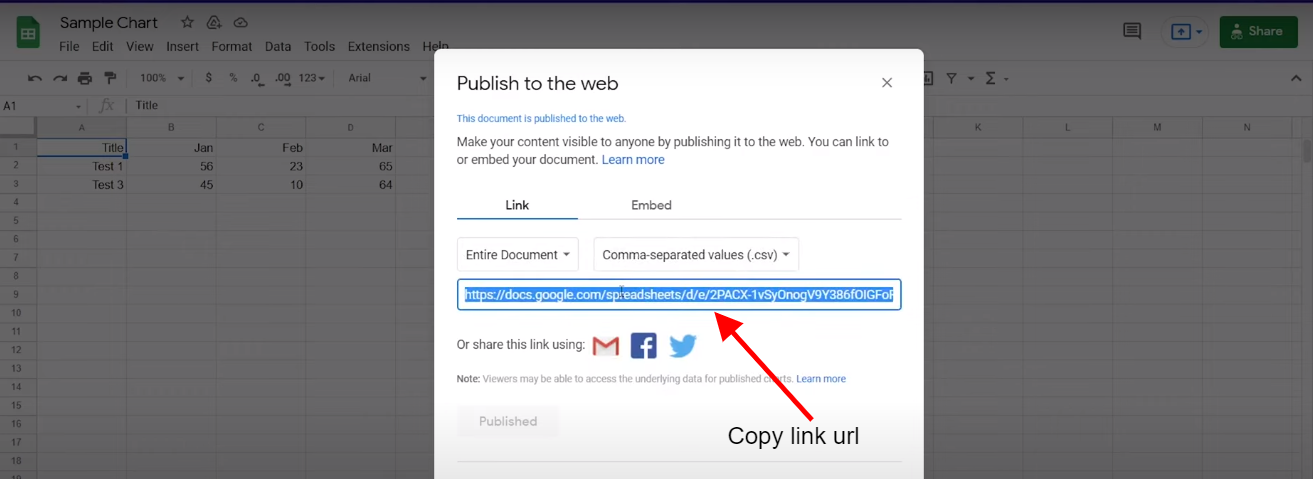
Step 9:-
Then Copy the link that has been embedded
Step 10:-
Then paste the copy to the Enter Google sheet Published URL.
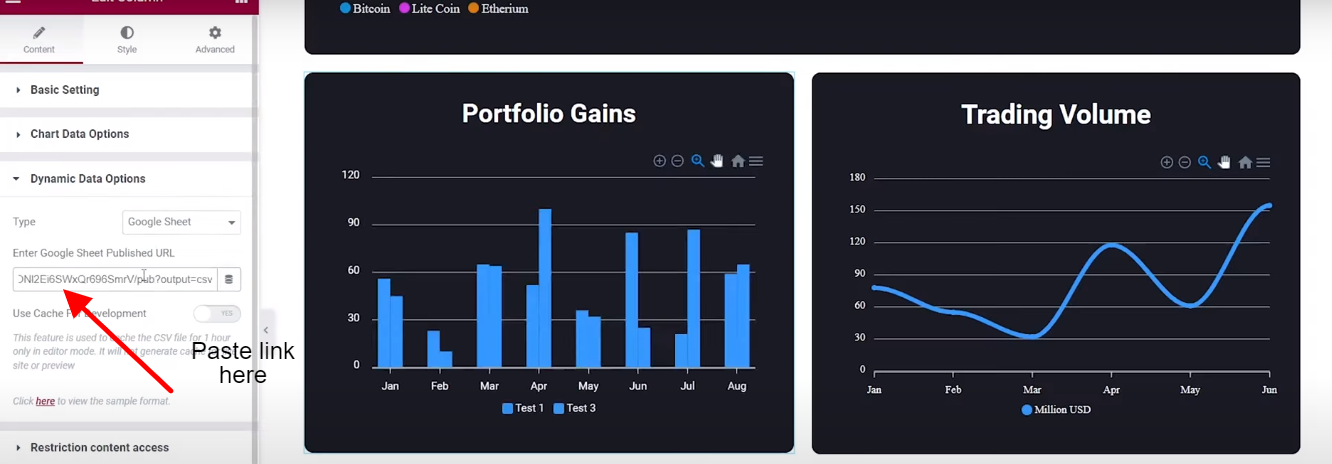
After that, you can see the changes in the chart.
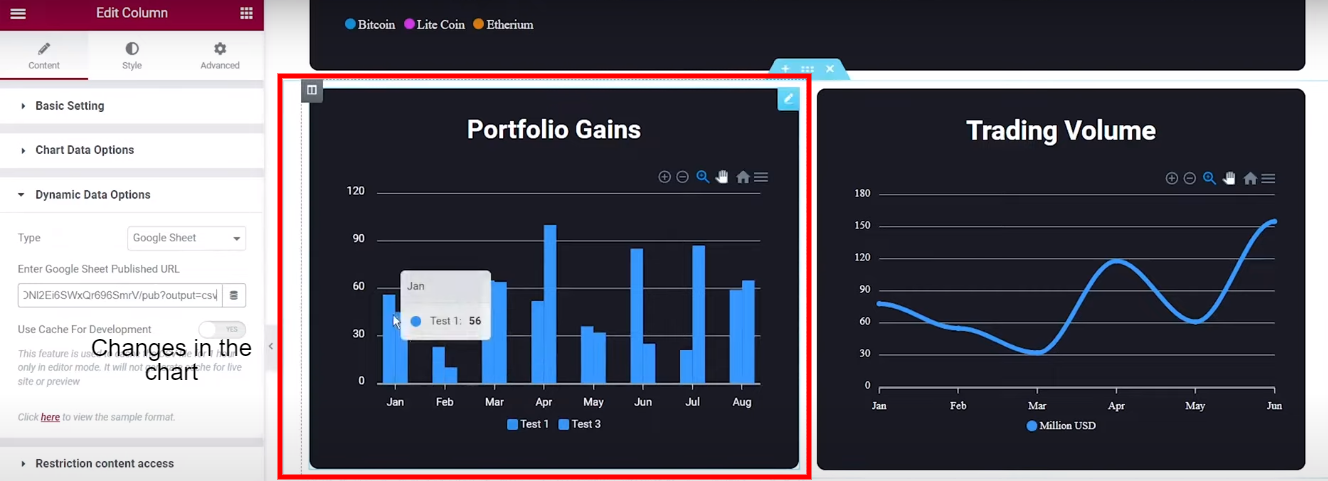
You can see how easy it is to add a chart in such a minimal time. Not a simple chart but an elegant and informative chart in such a minimal time. Impressive isn’t it?
Share it further to your knowledge and let them know about Google spreadsheet to WordPress chart conversion using one of the Best Data Visualization Plugins that are Graphina.
Was this article helpful?
YesNo


