
How To Create WordPress Stats Page
718 Views
Want to know how your Blogs impact, Newly registered users, Viewers and many more things affecting your audience.
You can know about how these things work with the help of Google analytics but it wouldn’t give you all the information with a bit of pain in the rear and it would become very tempting when you need to see something that you have been working on hard-on for. And when you want to look at its results you will need to go for Google analytics and then where you will learn about reaches on your site.
Now you may say, you are telling me the thing which I already know about on how to look out for ranks through Google Analytics!
But what if I say that I am going to sort you out with this by sharing with you a WordPress Chart Plugin with a Stats page that helps you directly look at the effect of your content on your viewers.
Click-here to get Graphina and make up your own wp statistics neatly.
Now skipping this Google analytics we are going to need to have a WordPress charts and graphs plugin and I will show you a couple of steps that will assist you on creating a WordPress Stats Page.
So let’s now take a dip at steps for Creating a WordPress page statistics –
Step 1:- Activated Plugin
First of all, you need to use an activated plugin to work with Graphina- Tables and charts WordPress plugin.
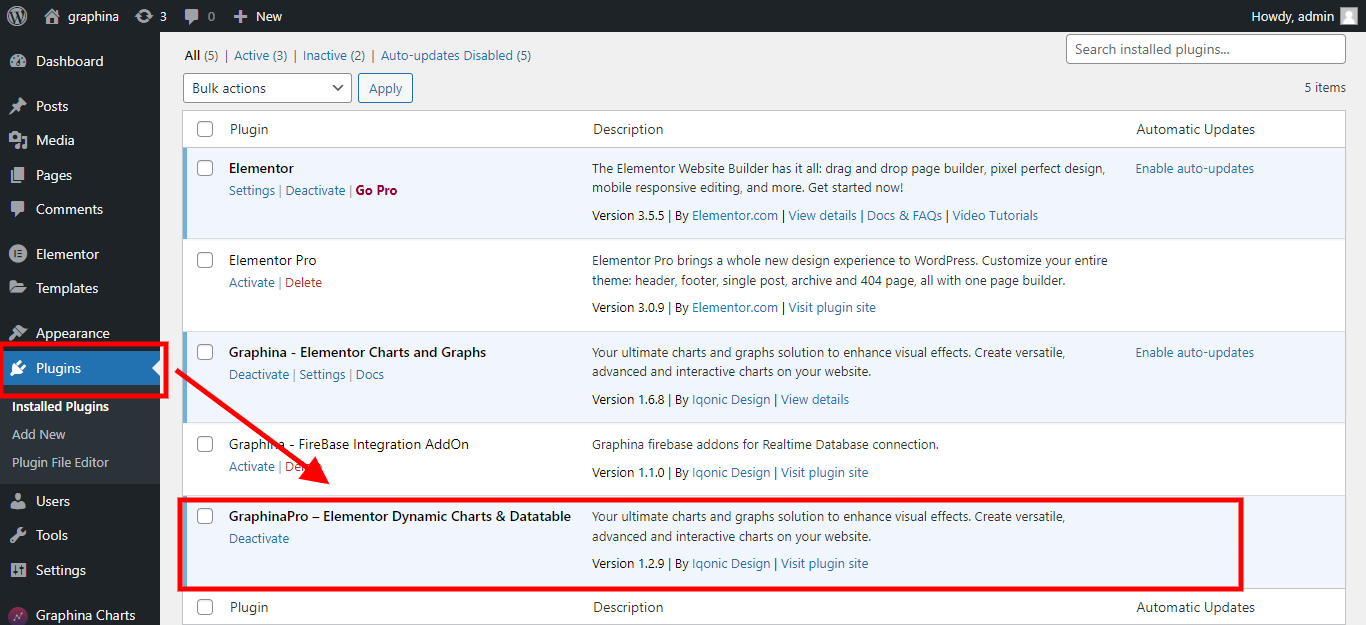
Here, In the above screenshot, you can see I have an activated elementor plugin for Graphina PRO – Elementor Dynamic Charts Graphs and Datatables.
Step 2 :- Go to Pages Menu
Further, going ahead click on the pages, a button which is available on the sidebar.
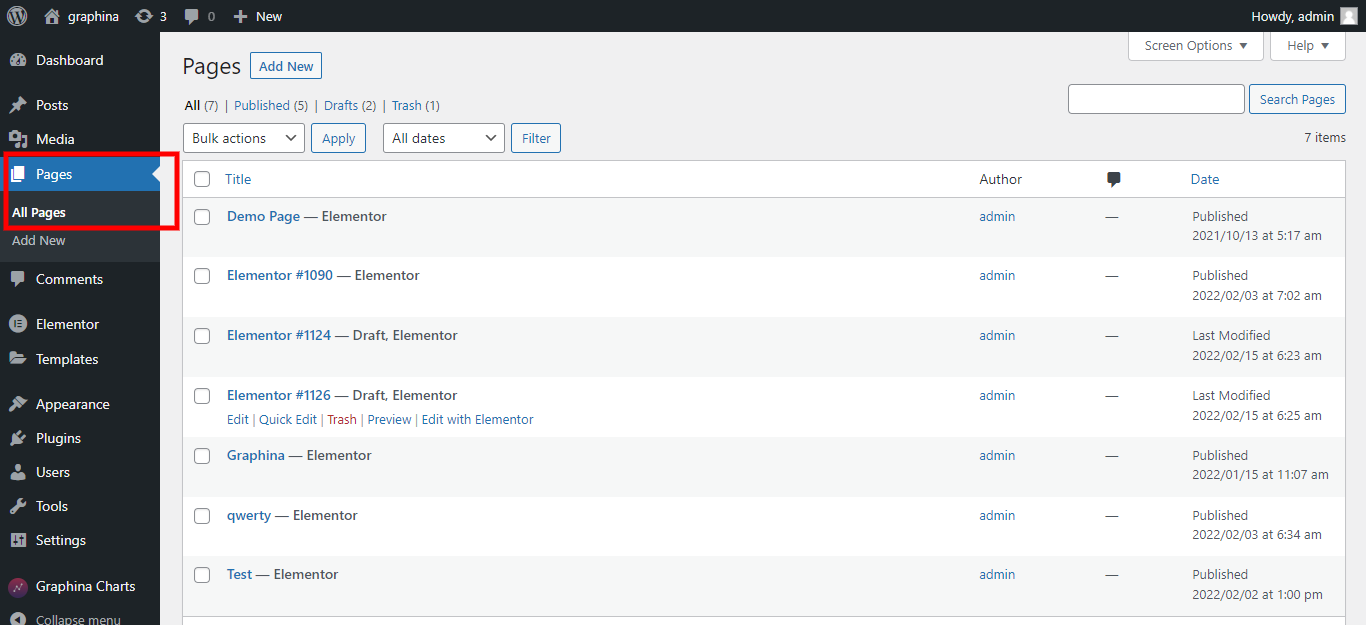
Why do we need a new page? it’s because we can make WordPress Stats Page.
Step 3 :- Create a New Page
As we showed earlier, Under the option of pages you need to click on an Add New Page and something like this will appear.
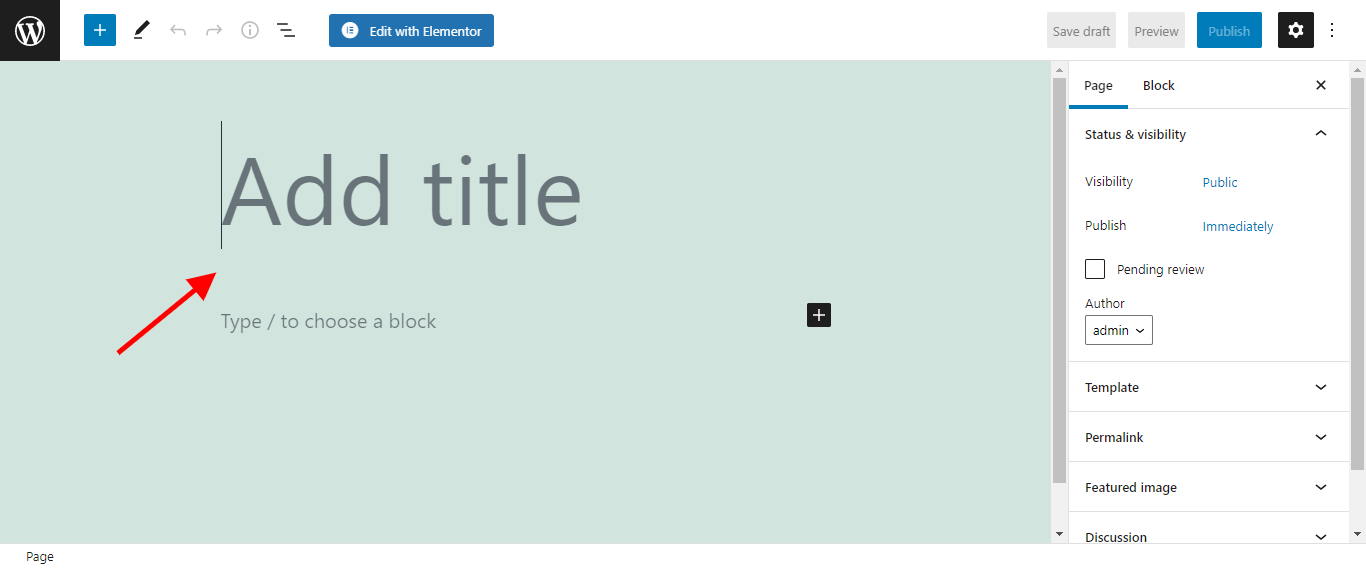
Now you need to title your chart, like Stats Dashboard and within that chart, you will be analyzing your viewers on Numbers of Blogs, Registered Users, Pageviews, etc.
Step 4 :- Edit with Elementor
As we have titled our chart with the name of Stats Dashboard, an option for customizing your chart will appear like Edit with Elementor click on it.
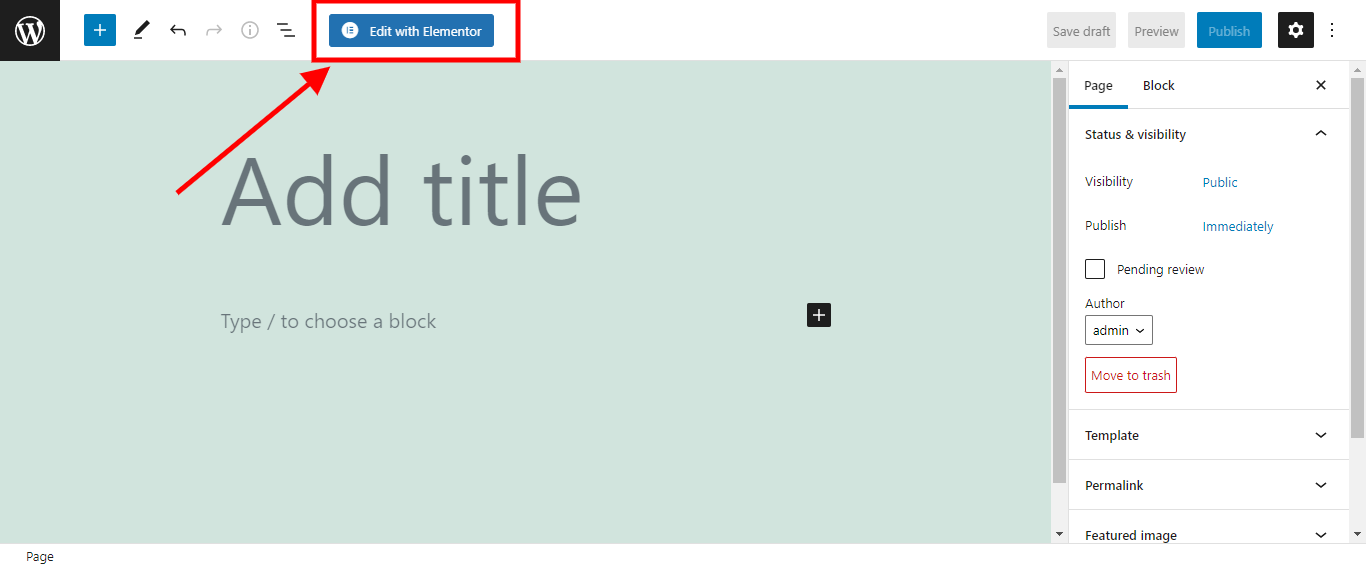
After Clicking on Edit with Elementor. This new page will appear on your screen.
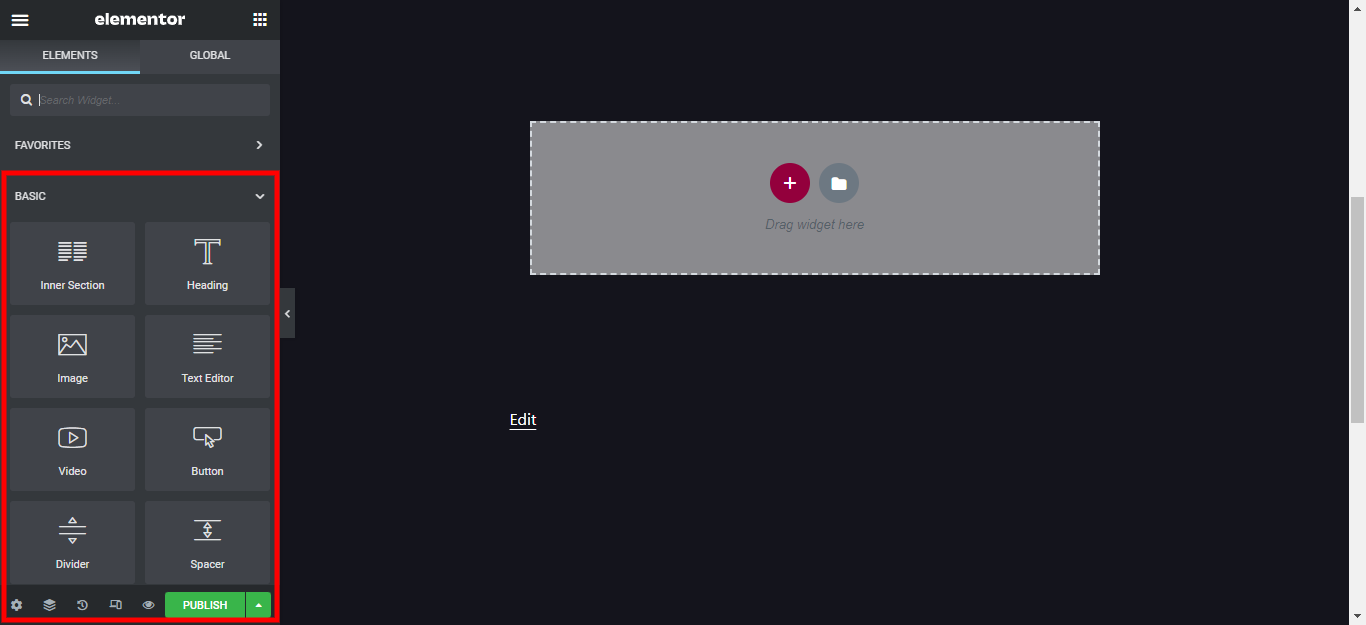
After Clicking on Edit with Elementor, you will land on this page and after that, you will see multiple widgets like this on your sidebar.
Step 5 :- Drag & Drop Graphina Chart from Elementor Widgets
These drag and drop features help you to create your WordPress chart by dragging the widget and dropping it on the page like this.
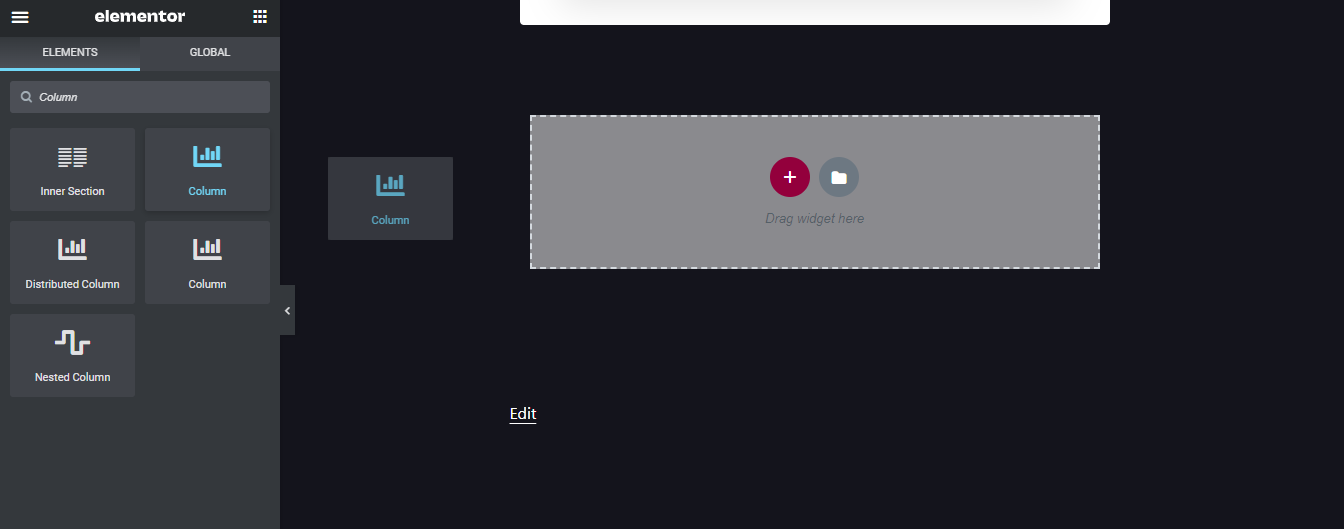
In this image, you can see how I’ve selected the column chart and dragged it on the page so that I can set my data in that chart.
Now in this, you can see how easily and in just a few steps I’ve put the column chart within a couple of seconds while using my Graphina – Data Visualization WordPress Plugin.
As we are on the landing page of the Graphina – Elementor Chart and Graph plugin. The multiple widgets on the sidebar will assist in creating a chart where you can set your wp statistics and the regular evaluation of the reach out of your site.
Now I will show, how within just a few steps Number of blogs, Registered Users, Pageviews, etc can be added.
Step 6 :- Adding Number of Blogs, Registered Users, Pageviews
As you saw earlier, on how we ended with the chart. So now further we will turn that Normal chart page to our WordPress Stats Page.
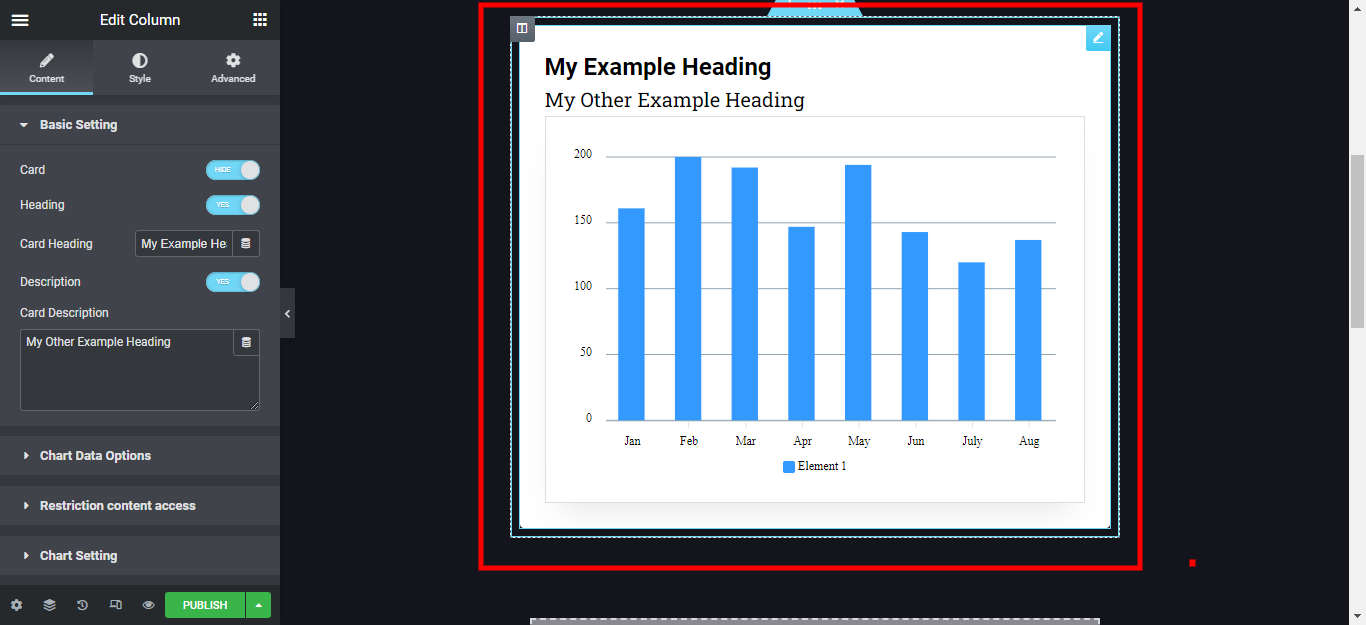
First of all, We set the title. First Click on the Card Heading and name the title to Stats Page.

Now first there is an option of showcasing card description and then we will write the short description and add the Number of Blogs, Registered Users, Pageviews.
It will somehow look like this image below.
After doing all that now we will add the Number of Blogs, Registered Users, Pageviews data to the chart.
Now going further, Click on Element 1, and then you will see something like this multiple options will appear on your screen.
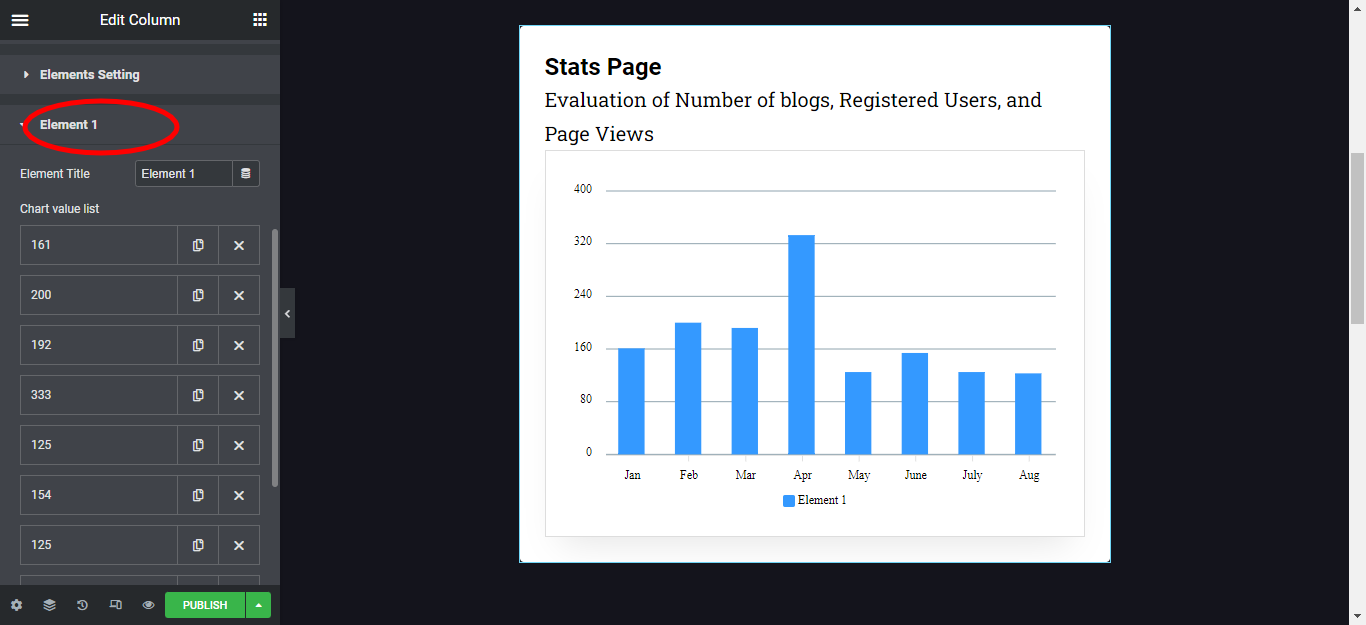
Something like this multiple options will appear and then going further, scroll till the ending of Element 1 and you will see the Categories that shows the Items where you values are seen. Something like the below image.
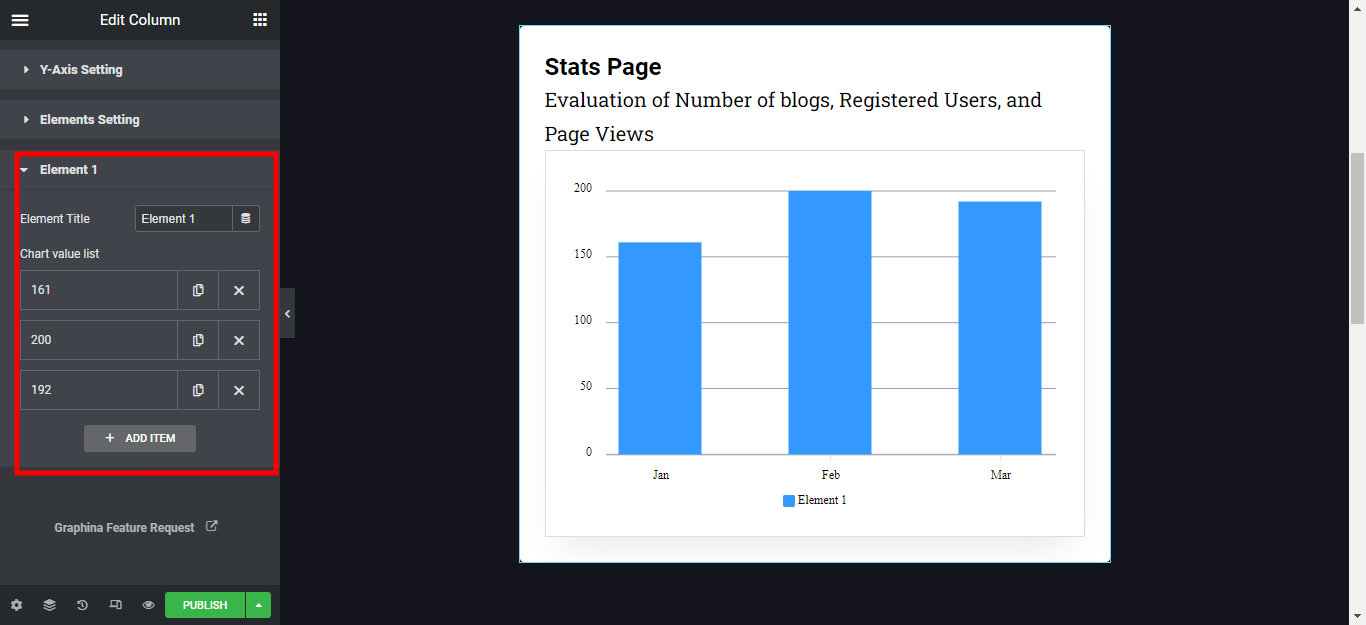
Now that we will cancel all the items, what we will do is live with only 3 items are Number of blogs, Registered Users, Pageviews and the card will look something like the below image.
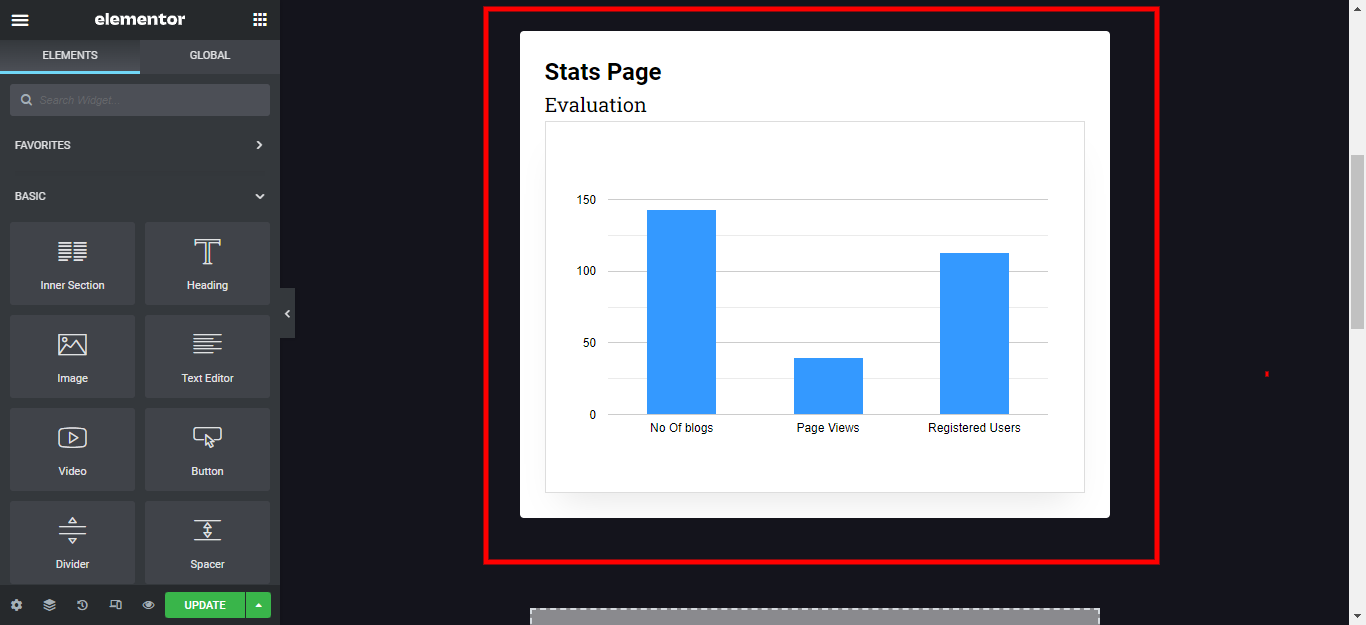
Now you can see how easy it was, to set up your WordPress Stats Page with Graphina- tables and charts WordPress plugin.
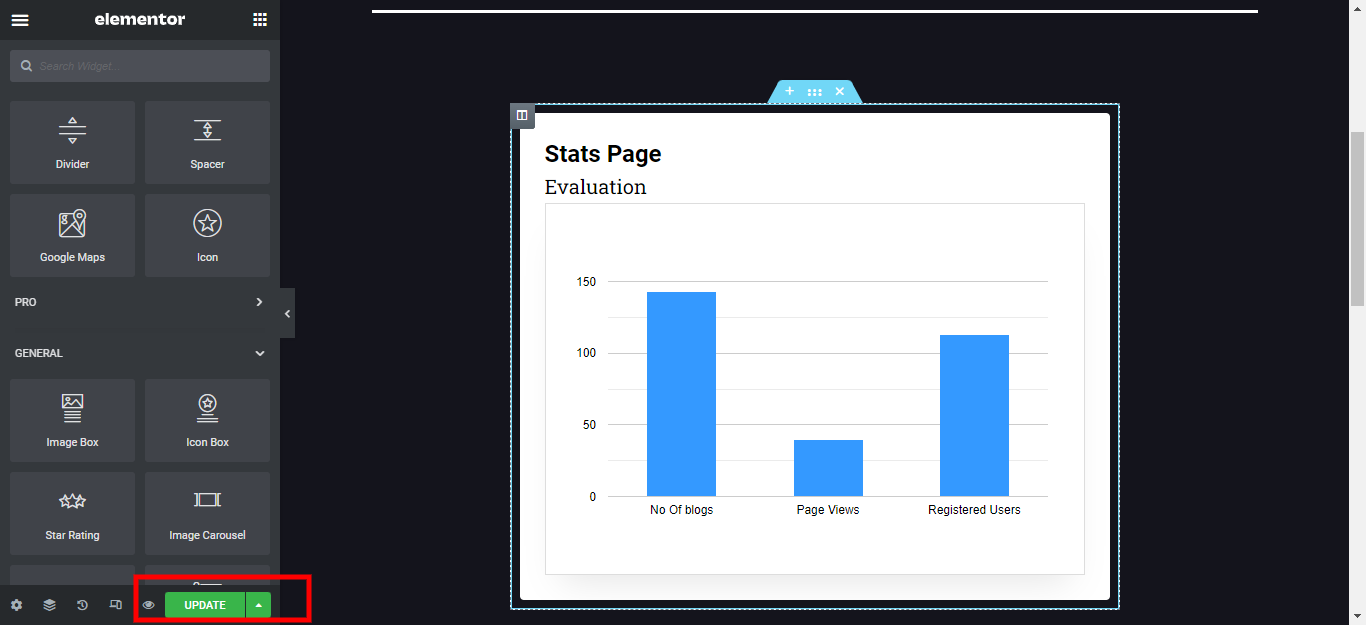
Now the last thing to look out for, click on the Update button at the bottom of the Sidebar. So that all customization can be saved.
You can also customize your chart with multiple options as per your requirements.
So here we are at the climax. Learned how to create WordPress Stats Page and that’s how easy it has been created within just a few steps and a couple of minutes.
Conclusion
Easy steps are taught on creating WordPress Stats Page seeing the constant evaluation of No. of Blogs, Registered Users, Pageviews and have a smooth experience with Graphina – Best Data Visualization WordPress plugin.
Don’t Forget to Subscribe to our Youtube channel to get an instant video tutorial. Follow us on Facebook and Instagram to get Quick Tips, Educational Posts, infographics, and a lot more.
Was this article helpful?
YesNo


