
Finally! Easiest Way to Create Graphs and Charts in WordPress Website
1204 Views
Everyone wants to know how to make Graphs and Charts in WordPress Websites but no one wants to deal with complex software. Whether you are a business owner a marketer or an independent website creator, having a flair for representing information is an added advantage.
Working with WordPress websites comes with the beauty of user-friendliness and a pool of plugins to add functionality as and what we desire. Numerous WordPress data visualization plugins can let you create powerful Charts, Graphs, Datatables, and Counters without getting invested in coding and analytics.
In this article, we will show you the most convenient way of creating Graphs and Charts in WordPress websites by ditching extra coding, designing, or any complex analytical expertise.
We have split the article into two sections –
i) On how to Install the Graphina plugin and
ii) Steps to create interactive Graphs and Charts on the WordPress site using our favorite Graphina Pro – WordPress data visualization plugin. These beautiful charts and Graphs will showcase your data in the most beautiful and highly influential way possible.
Below are the steps that should be taken, to install the most powerful WordPress Charts and Graphs plugin Graphina on your WordPress Elementor website:
Step 1 – Installing through WordPress Dashboard

Firstly, open the WordPress admin panel login page and log in to WordPress as Admin. To do this visit http://yoursitename/wp-admin
Step 2 – Add New Plugin

Go to Plugins section and Add New plugin
Step 3 – Upload Plugin
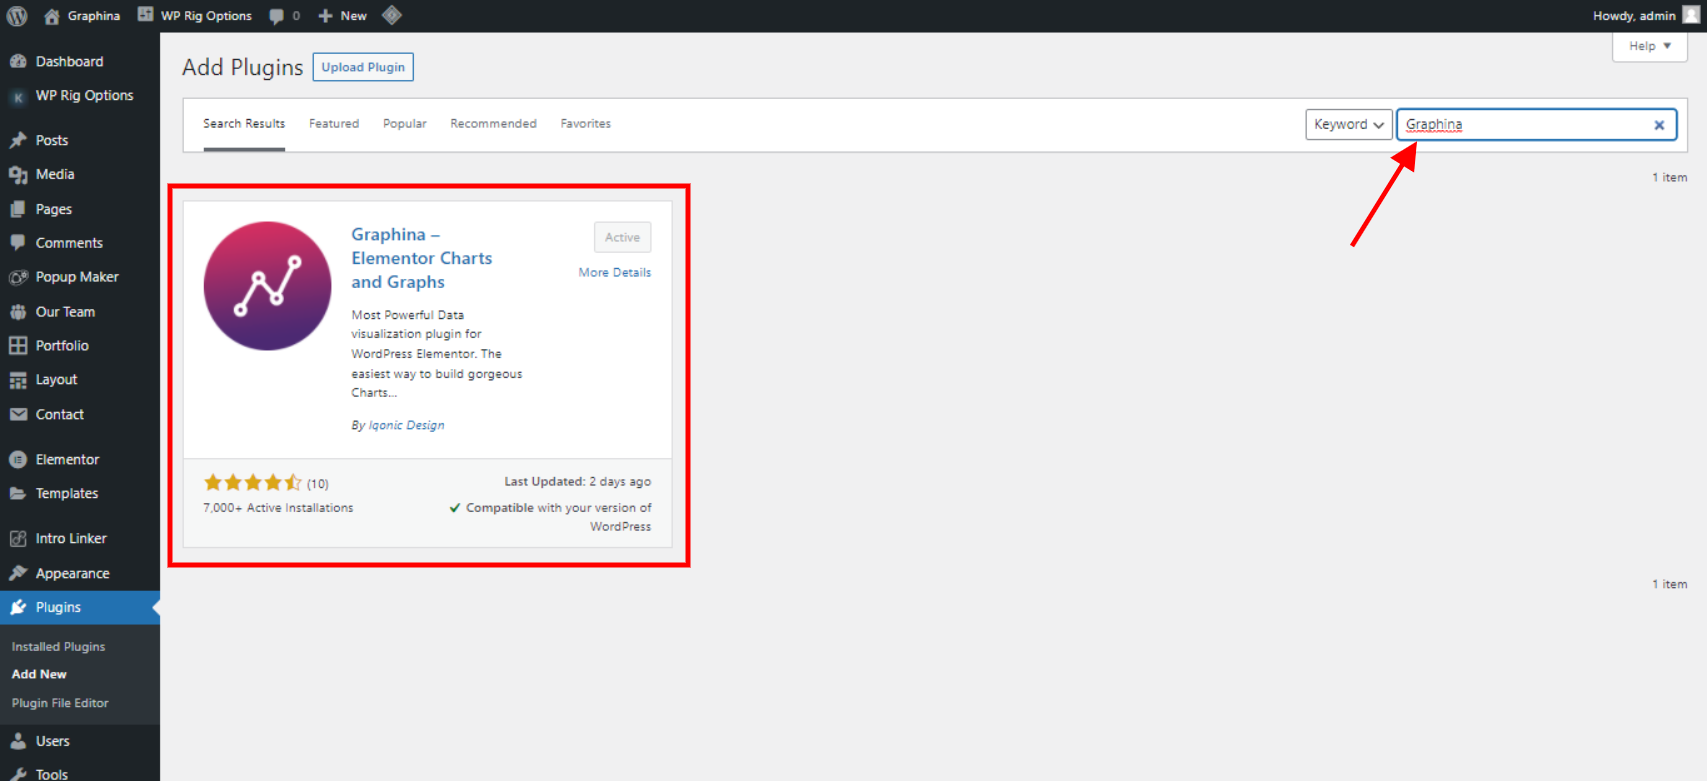
Upload Plugin to WordPress from Featured, Popular, Recommended, and Favourites list. Look up for Graphina – tables and charts WordPress plugin.
Step 4 – Install Graphina

Choose and upload the archive with the Graphina Plugin and press the Install Now Button.
Step 5 – Activate Graphina

After Installing the plugin, click on the Activate button shown in the image
There you have successfully installed the Graphina – WordPress Chart plugin on your WordPress Elementor website. It’s time to move on to the second part of this article. Following are steps to create and embed WordPress Charts and Graphs on your Elementor-supported website. We will be taking manual data to assist the beginner-level creators. Let’s dive right into creating a mix chart using the Graphina – WordPress chart and graph plugin.
Step 1:- Open the Elementor page builder and select the type of WordPress chart or Graph you would like to create from the Graphina Charts widget. We will select the Mix Chart widget from the directory.

Step 2 :- Drag and drop the widget on the section where you wish to add the Mix chart on your website.

Step 3:- The Mix chart you see comes with great customization options. Take a look at the alternatives to edit from Mix Chart settings and launch a WordPress Mix Chart as you wish without any code wrestling.

Step 4:- Customize the color options of your Mix chart using a color customization alternative in Graphina

Step 5:- Update the chart and preview it on your browser.

The result you will be getting after all these steps is that you have created beautiful Graphs and Charts in WordPress.
Do you know what a WordPress Plugin is? Looks the most appealing after all this and comes with high-tech features! And that Plugin is Graphina PRO – Elementor Dynamic Charts, Graphs, & Datatables.
Click-Here to get one of the Best Data Visualisation WordPress Plugin.
Conclusion
Follow these given few steps and the result you will receive is creating beautiful Graphs and charts. And all of those steps are given briefly and in a nice way. Give it a go with a Graphina PRO – Elementor Dynamic Charts, Graphs and Datatables and you will have an amazing experience.
Don’t Forget to Subscribe to our YouTube channel to get an instant video tutorial. Follow us on Facebook and Instagram to get Quick Tips, Educational Posts, infographics, and more.
Was this article helpful?
YesNo


