
How to Configure a Geo Chart in Graphina?
620 Views
Graphina is a powerful data visualization tool that allows you to create stunning visuals from your data. With Graphina, you can easily create sophisticated charts and graphs for your data, including geo charts.
A geo chart is a data visualization tool that is used to display data on a map. There are many different ways to configure a geo chart, and the right configuration will depend on your data and your goals. For example, By adding countries that were most affected during World War 2 on Geo chart.
In this blog post, we will explore how to configure a Geo chart in Graphina. We will also provide a few tips and tricks to help you get the most out of your data visualization.
Following are the steps for configuring Geo Chart in WordPress chart and Graph plugin –
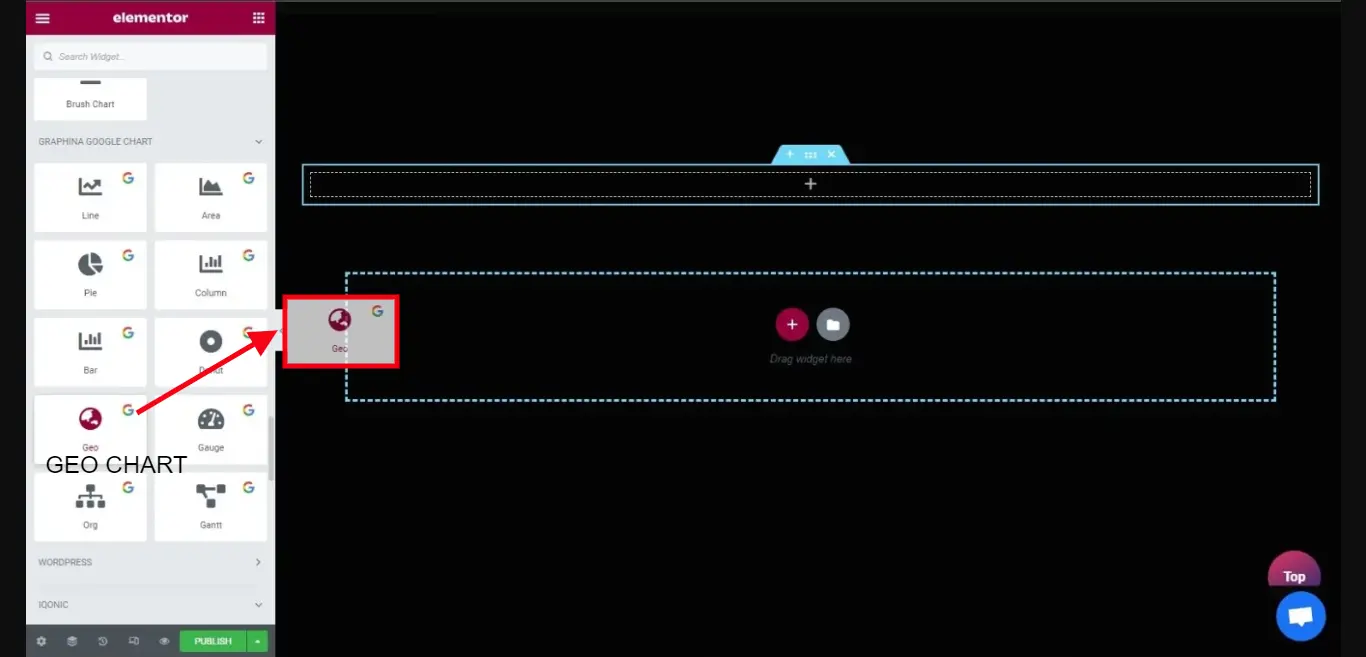
Firstly, as you can see in this Image how many Graphs and charts Graphina is offering. Out of these, you can see one of the charts is Geo Chart.
After doing such drag and drop off the chart, you can see how the Geo chart will appear.
Now let’s go further and we will customize our chart.
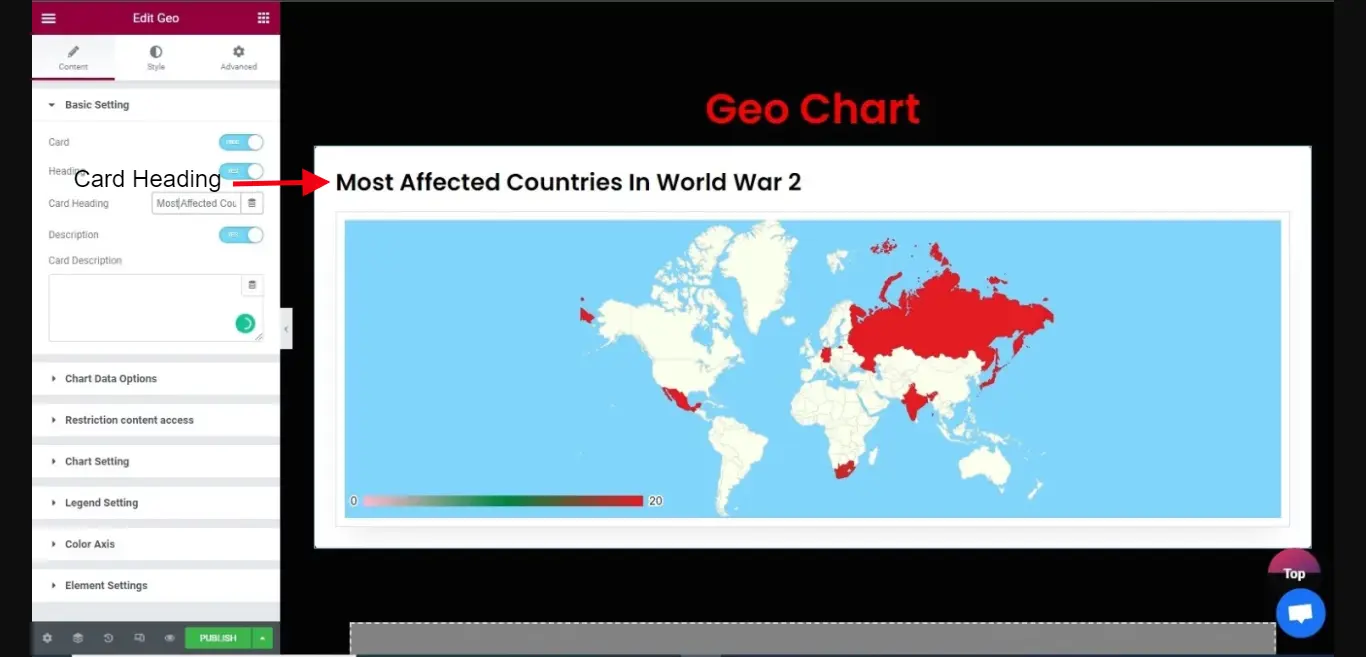
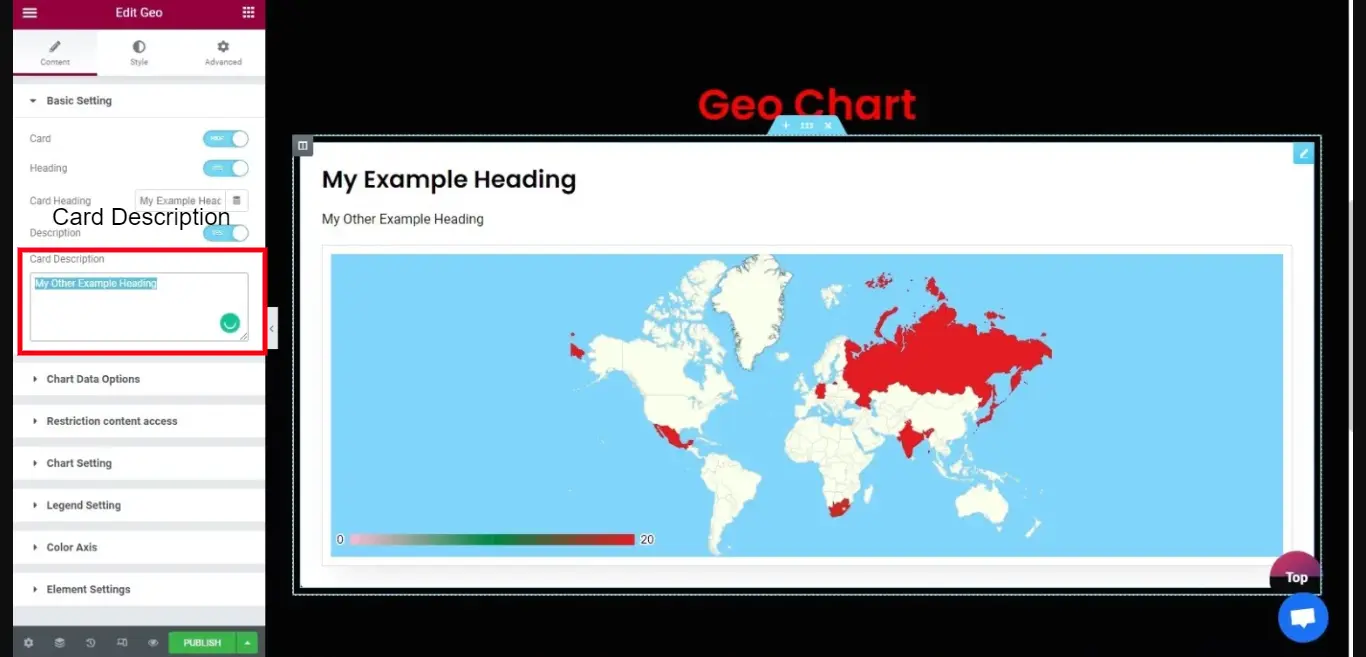
Firstly we will give the heading to the chart, by going on basic setting and changing the title by writing in Card Heading.
As you can see in the above Image I’ve written “Most affected countries in World War 2”
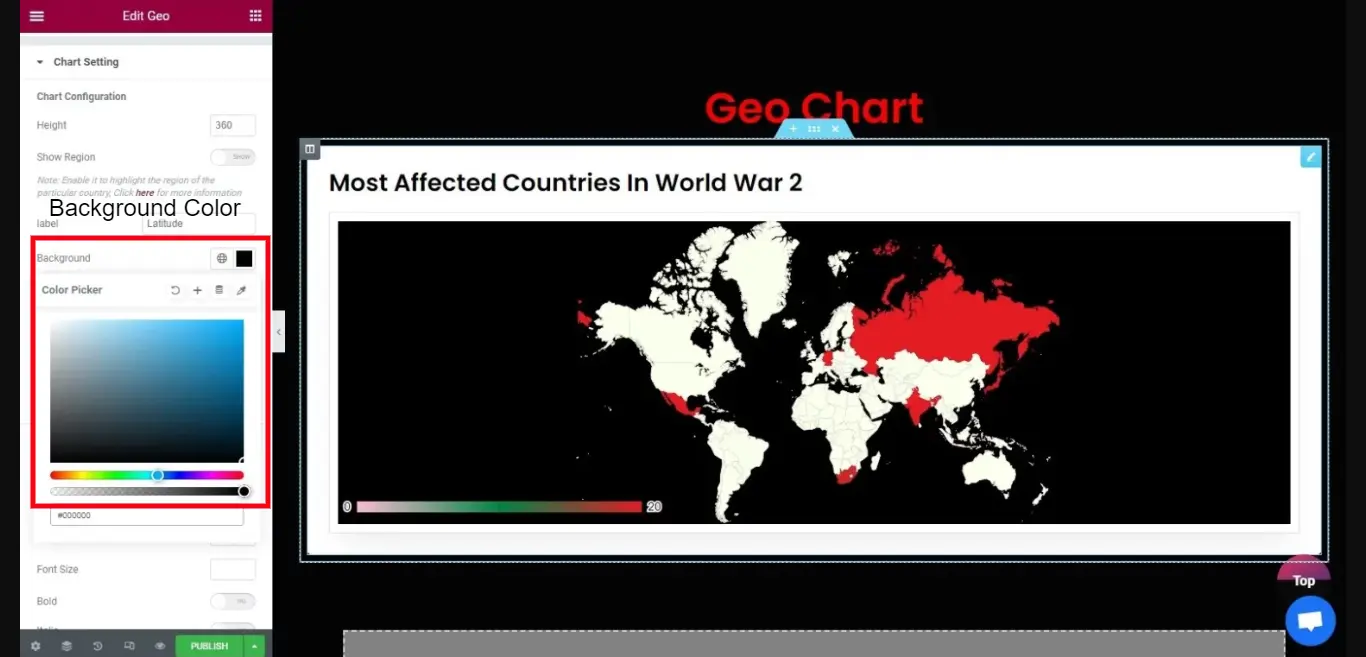
Then you can go to the Chart setting and can change the background color as per your requirement.
As you can see in the image I’ve changed the background color to black.
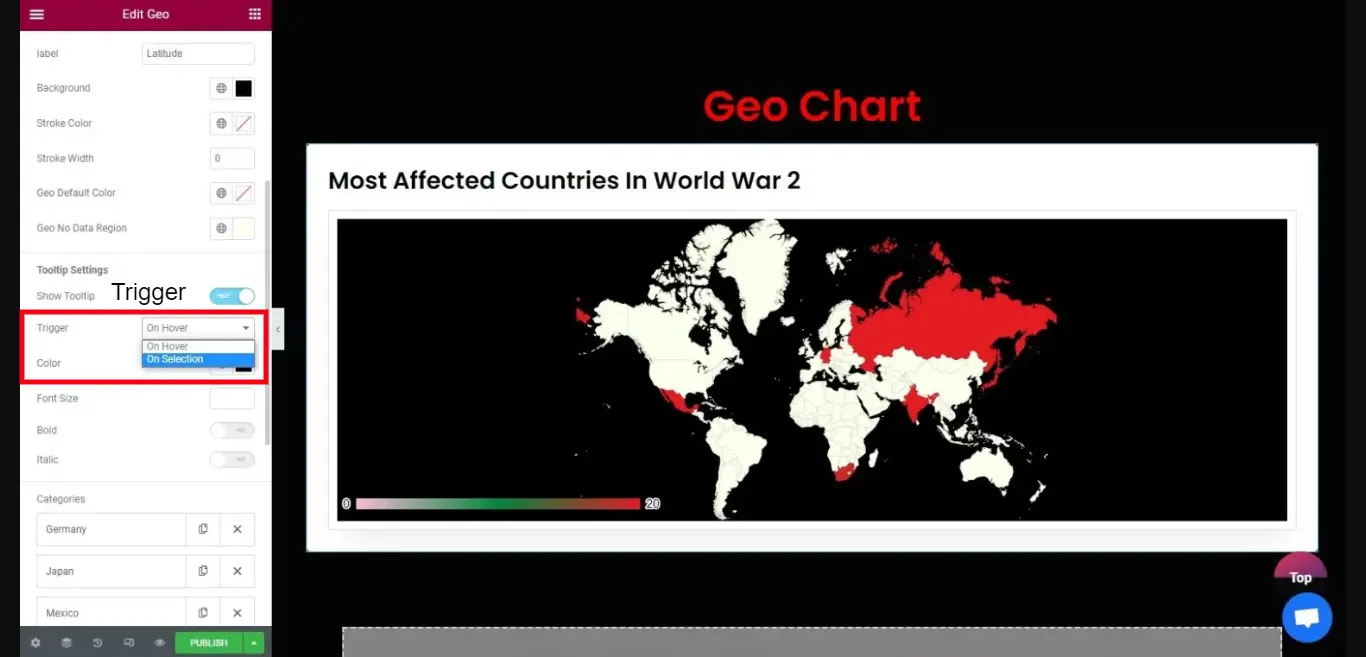
You can also choose the option on the Trigger section whether to keep it on Hover mode or on Selection mode.
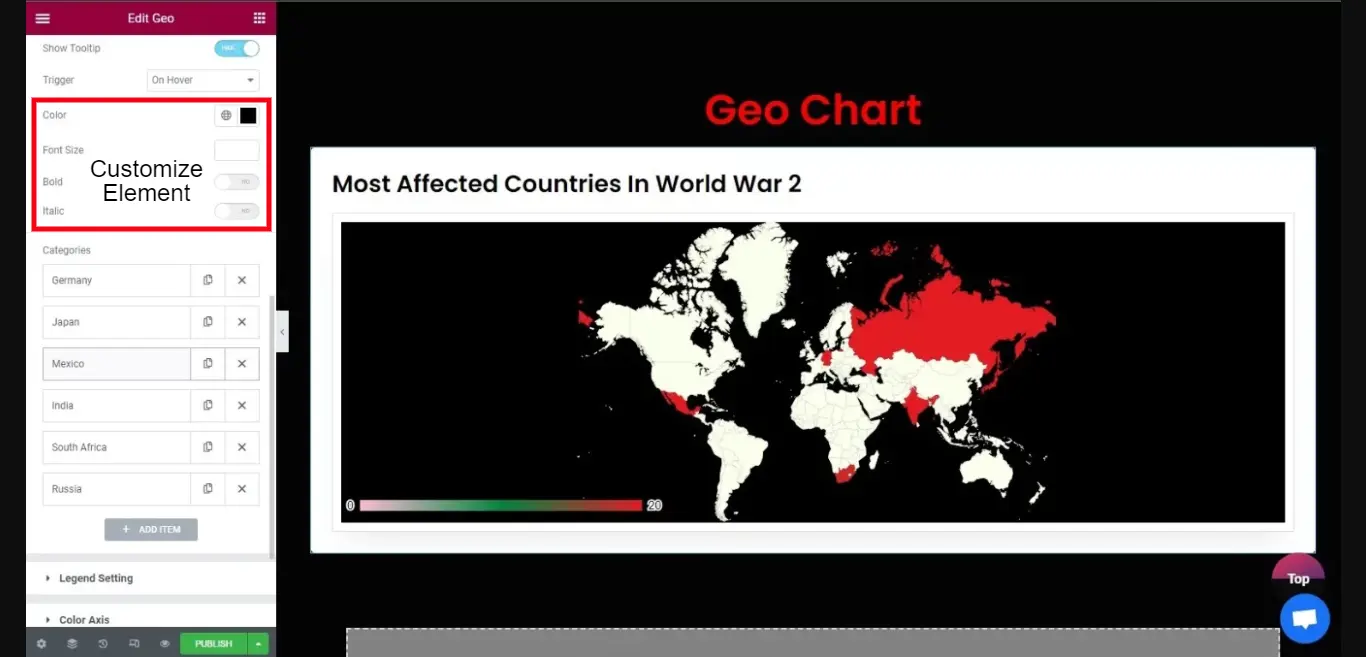
Here you can see add elements to your Geo Chart as per your requirement and you are also having multiple options for customizing the elements
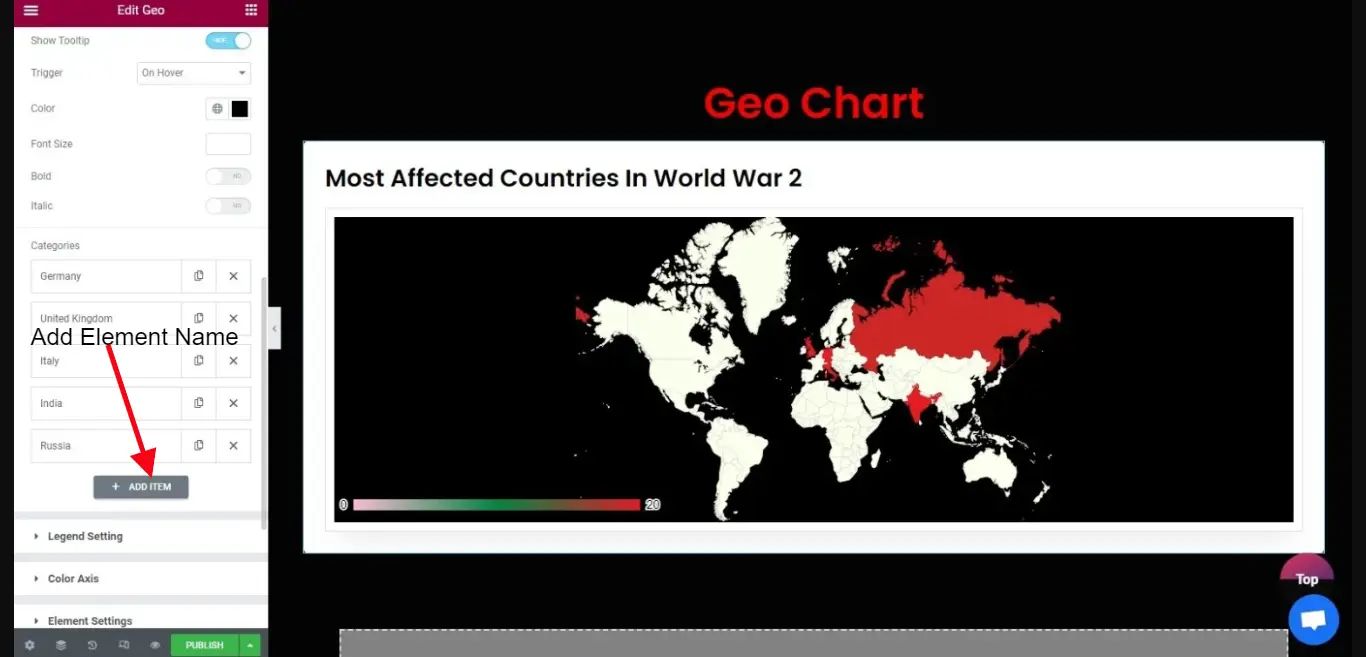
Now as you can see in the above image, I’ve added the elements by the name of the countries that were most affected.
Further, I will add elements to the countries as per the record of how much they were affected.
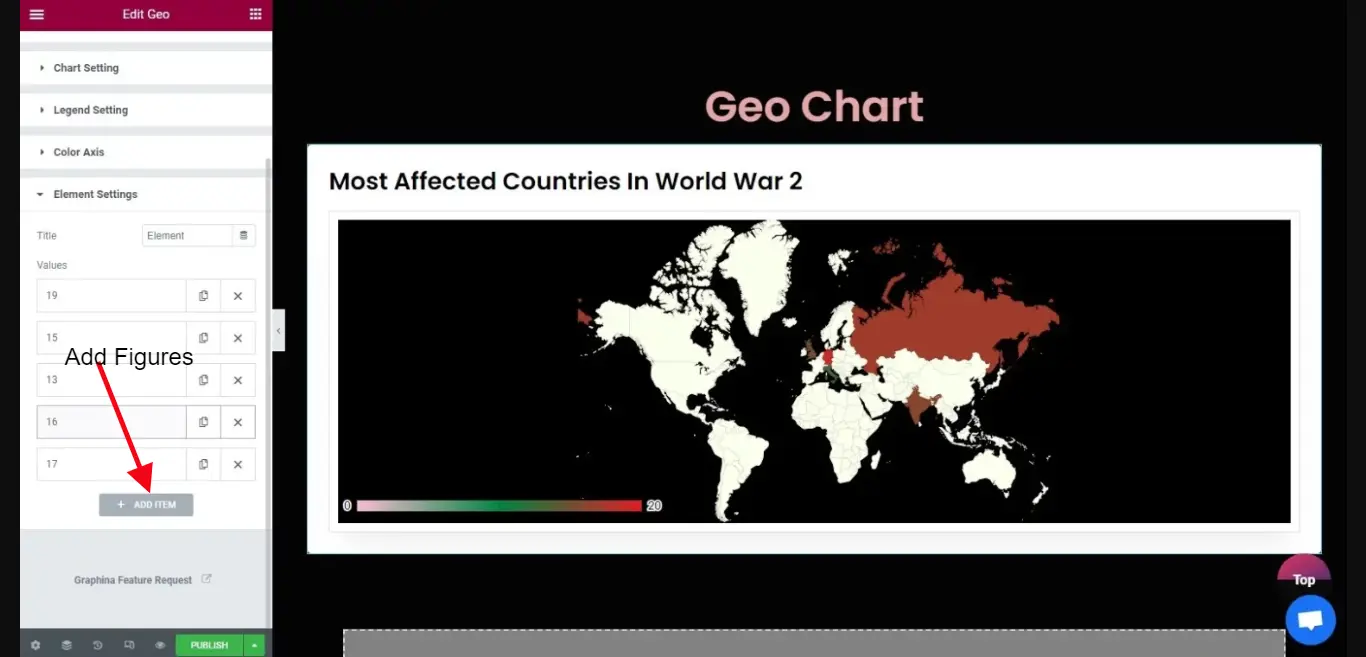
You can add figures to the elements as per the needs.
In the above image, you can see how I did.
That’s it, in just a few steps your whole Geo Chart is Ready by using Graphina – WordPress Chart Plugin.
Graphina – WordPress Chart and Graphs Plugin
As a WordPress user, you’re probably already familiar with the Elementor page builder. But did you know that there’s a powerful data visualization plugin called Graphina that can make your Elementor site even more effective? Graphina provides efficient and straightforward WordPress charting solutions that make data visualization quick and easy.
Graphina comes with 14+ graph and chart options, with over 1000+ variations. Business-specific charts like WordPress Line Chart, Column Chart, Nested Column Chart, Area Chart, Pie Chart, and Donut Chart are included.
Graphina Pro is the ideal solution for any of your WordPress charting requirements. With features like Ajax-based auto-reloading, user-based restrictions, real-time change options, scatter chart, conditional colors, filters, and external MYSQL connectivity, you can’t go wrong.
- 14+ Charts & Graphs
- 1000+ Variations
- Ajax Loader
- 100+ Customising Options
- Mass Data Securely Keeper
- No coding knowledge is required
Conclusion
If you’re looking for a way to visualize data on a map, Graphina’s geo chart is a great option. Configuring a geo chart is easy, and with a little bit of practice, you’ll be able to create stunning visuals that tell a story with your data.
Was this article helpful?
YesNo


