Real-time Firebase Charts And Graphs With Graphina
1056 Views
What is Firebase?
Firebase was developed with a Google-backed app development platform that was invented by James Tamplin and Andrew Lee in the late 2010s and officially launched in late 2012 and soon after that Google got its hands on this platform. As per its startup firebase was made up and designed as a real-time database but as soon as Google started to handle it started giving more services.
Speaking of common words, firebase is a base for software development that helps in building web applications and mobile applications. It is compatible with Android, iOS, and Unity setups.
Few advantages of using Firebase
1) Fast and Safe Hosting
2) Free Startup for new ones
3) Reliable databases
4) All-in-one platform
5) End-to-end development
6) Scalability
Now going further will share with you some of the steps from which we created the Real-time Firebase Chart And Graphs With Graphina.
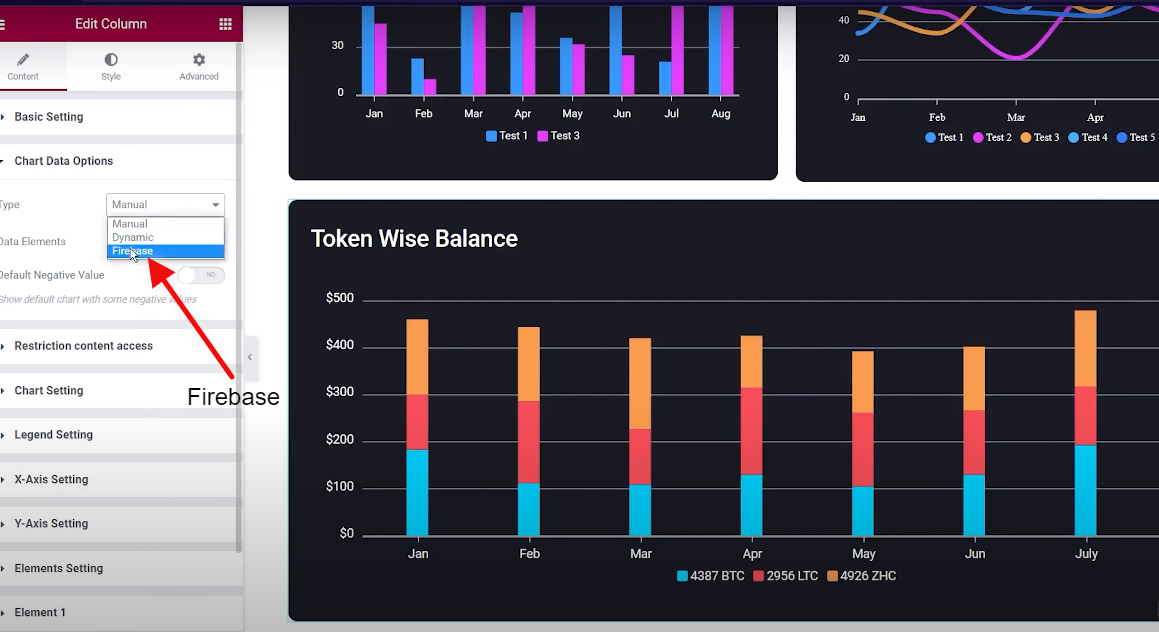
Step 1 – Changing Chart Data option type from Manual to Firebase.
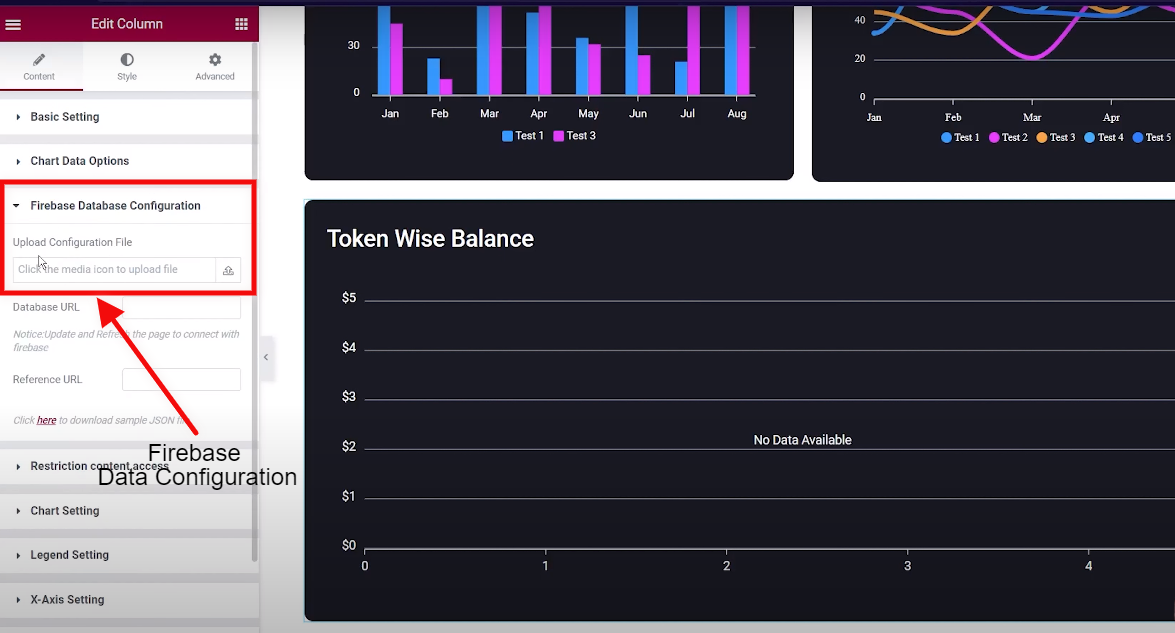
Step 2 – Then you will receive the option of Firebase Database Configuration where you will see the option of Uploading configuration File
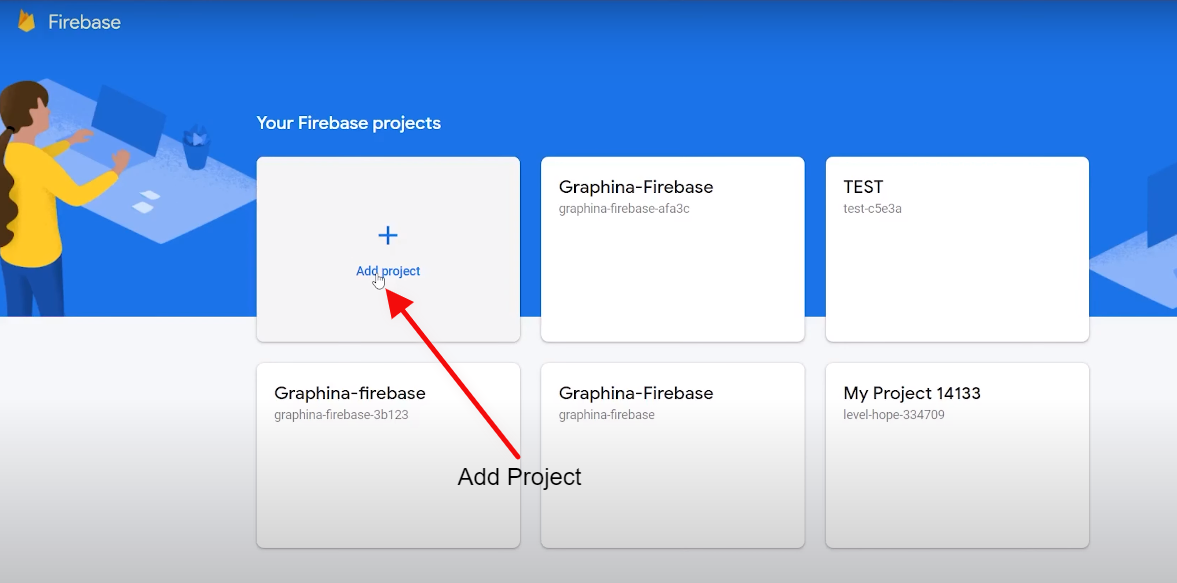
Step 3 – Go to firebase and click on add project.
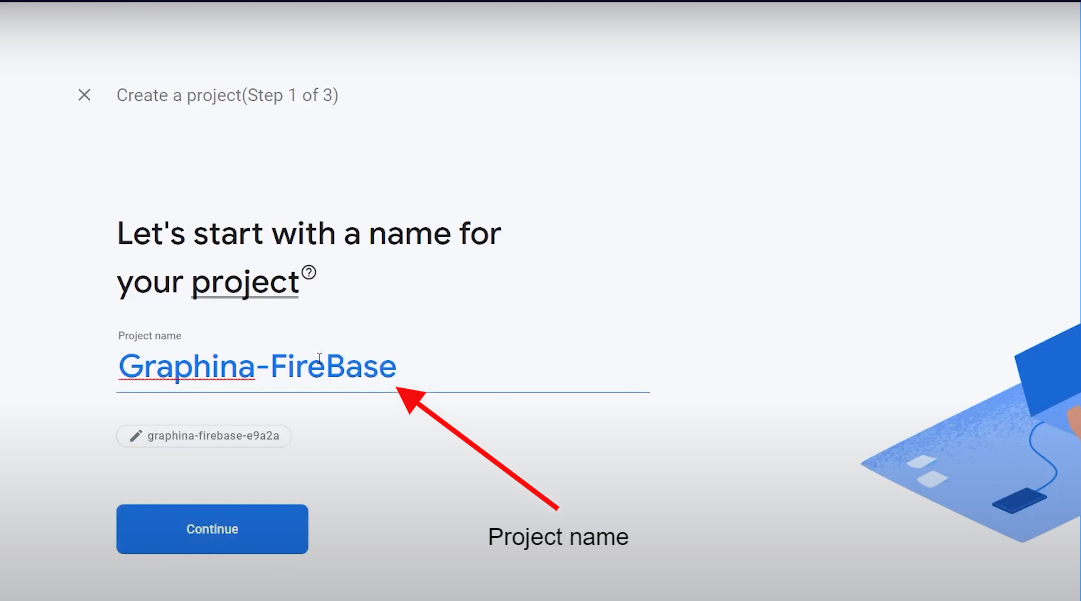
Step 4 – Name Your project and then click on continue.
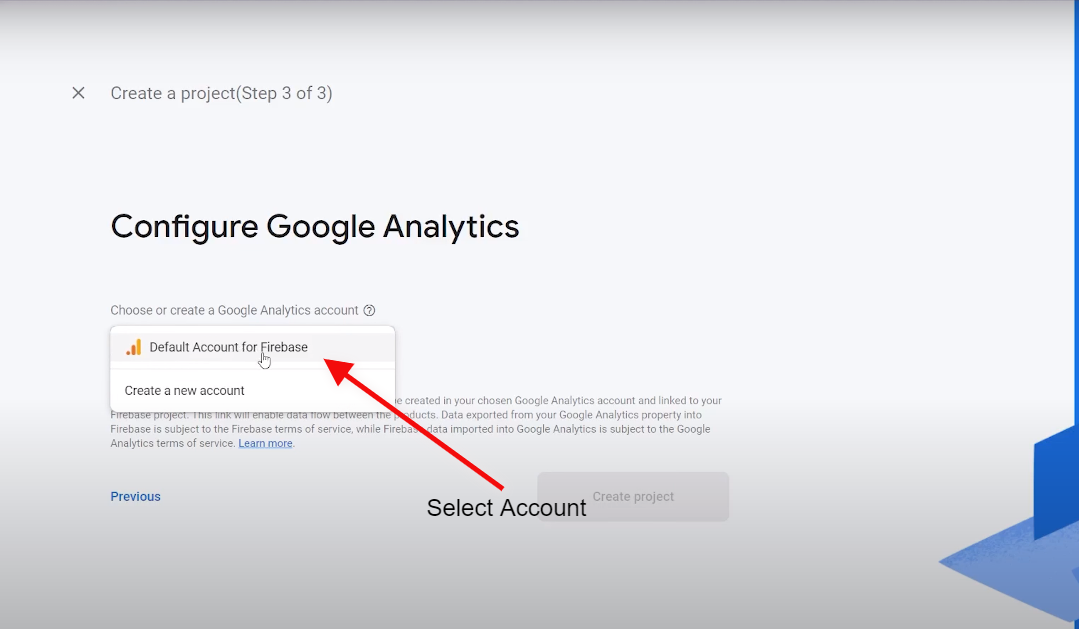
Step 5 – Select the Account.
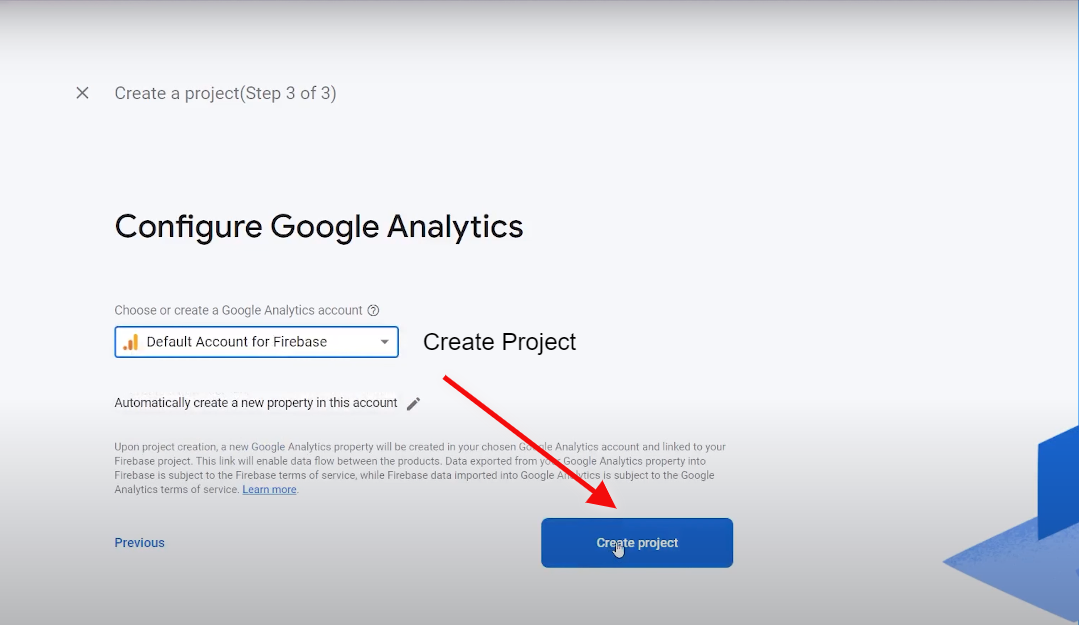
Step 6 – Then Click on the Create Project.
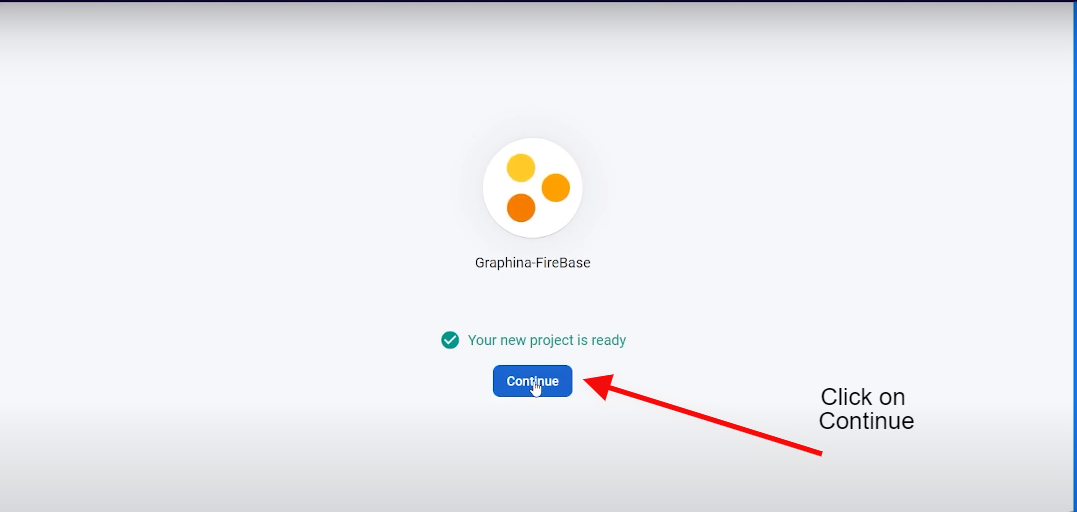
Step 7 – After the project is created click on the continue.
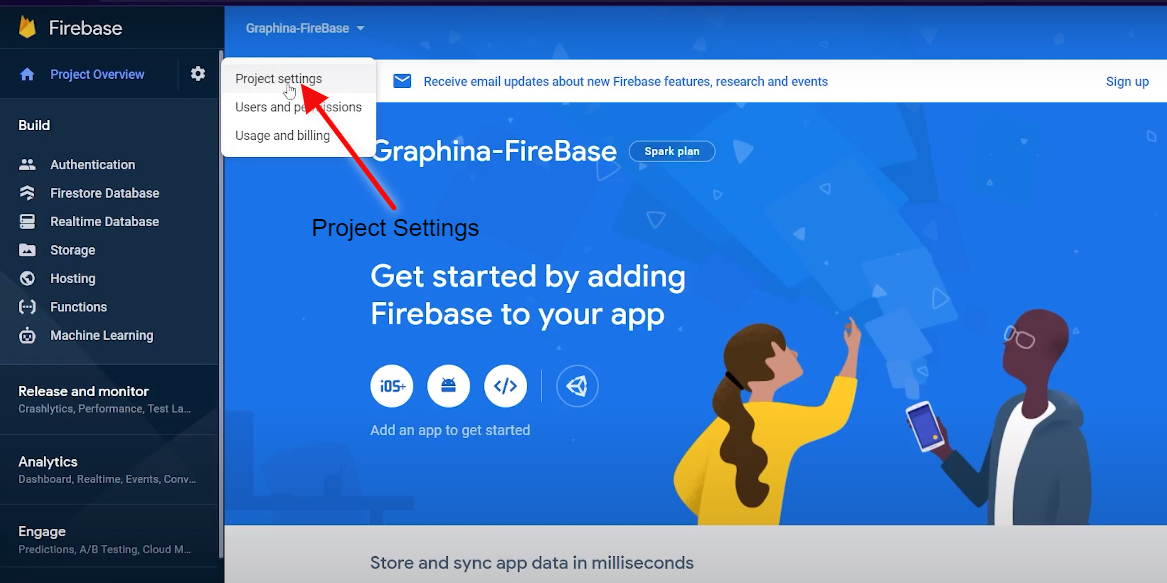
Step 8 – Go to the Project Settings.
Step 9 – Go to the service accounts.
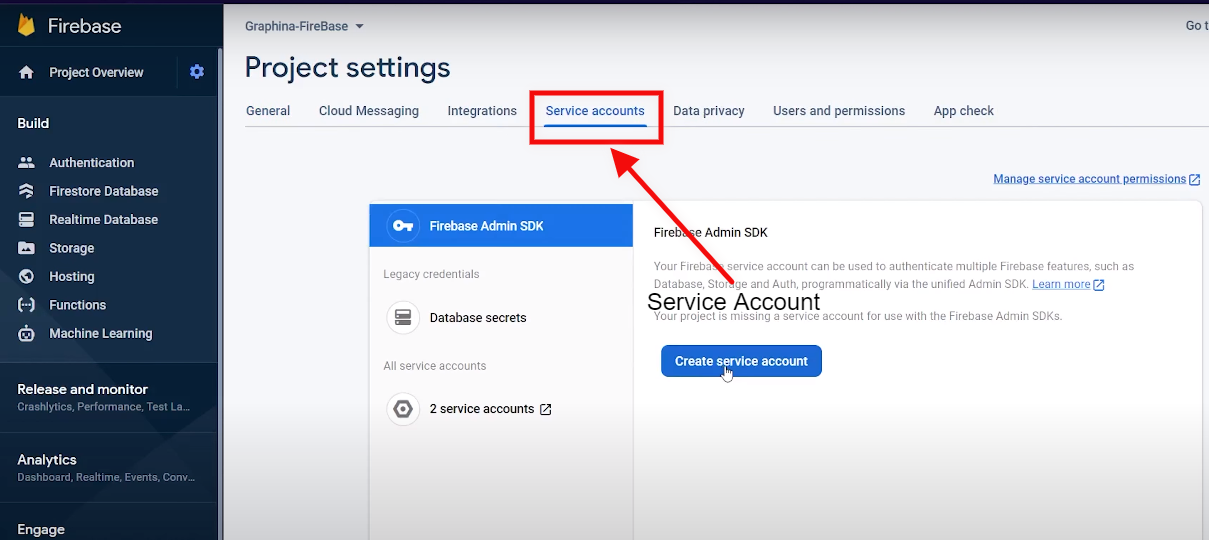
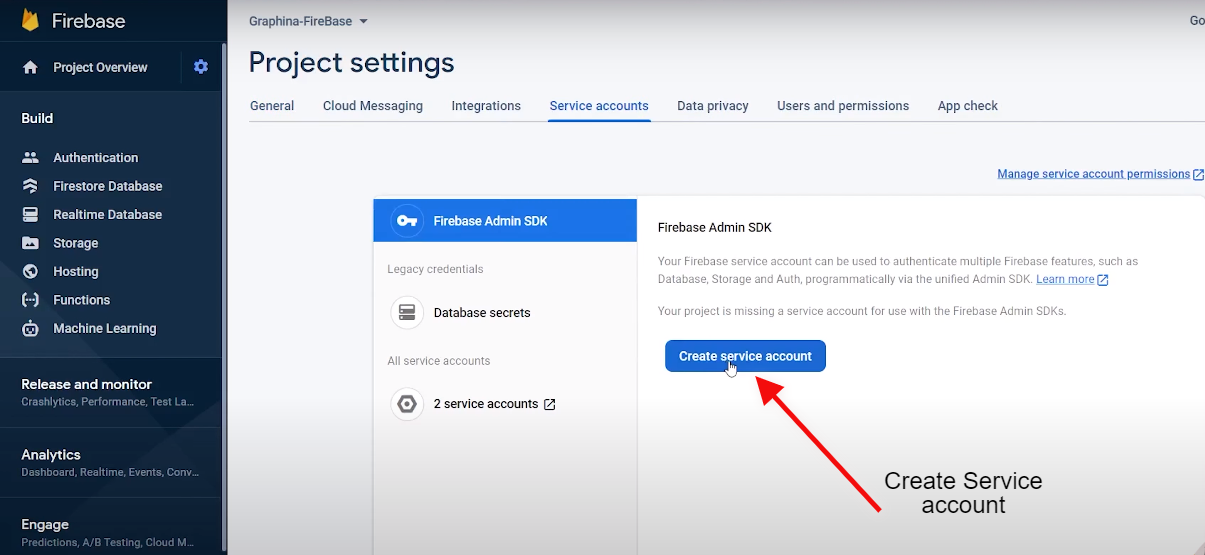
Step 10 – Click on the Create new service account.
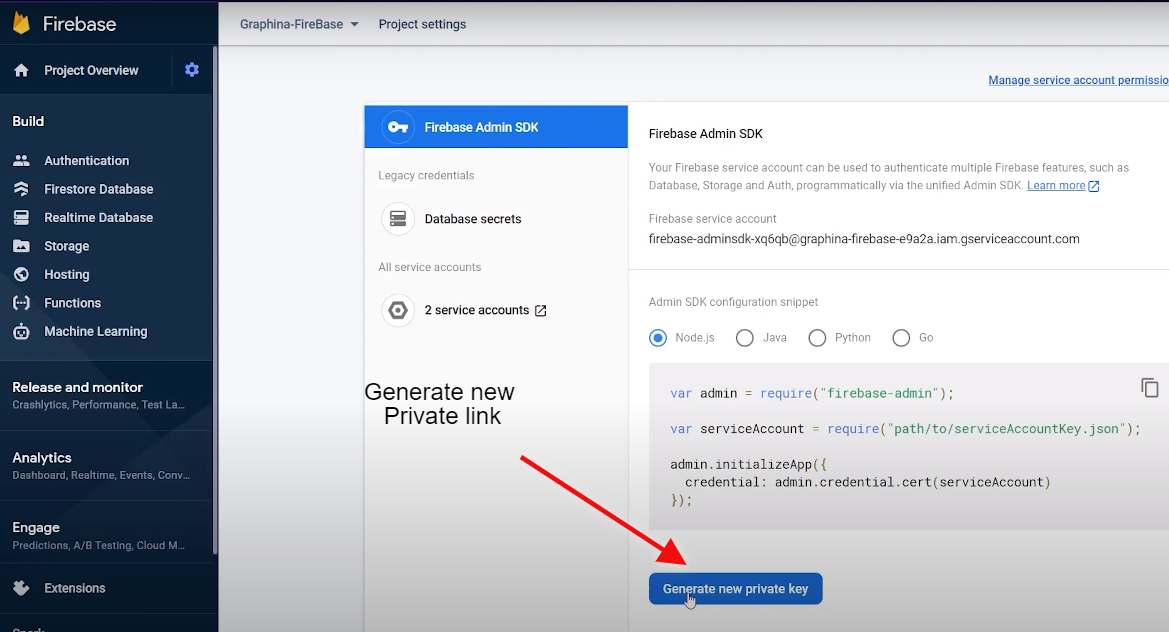
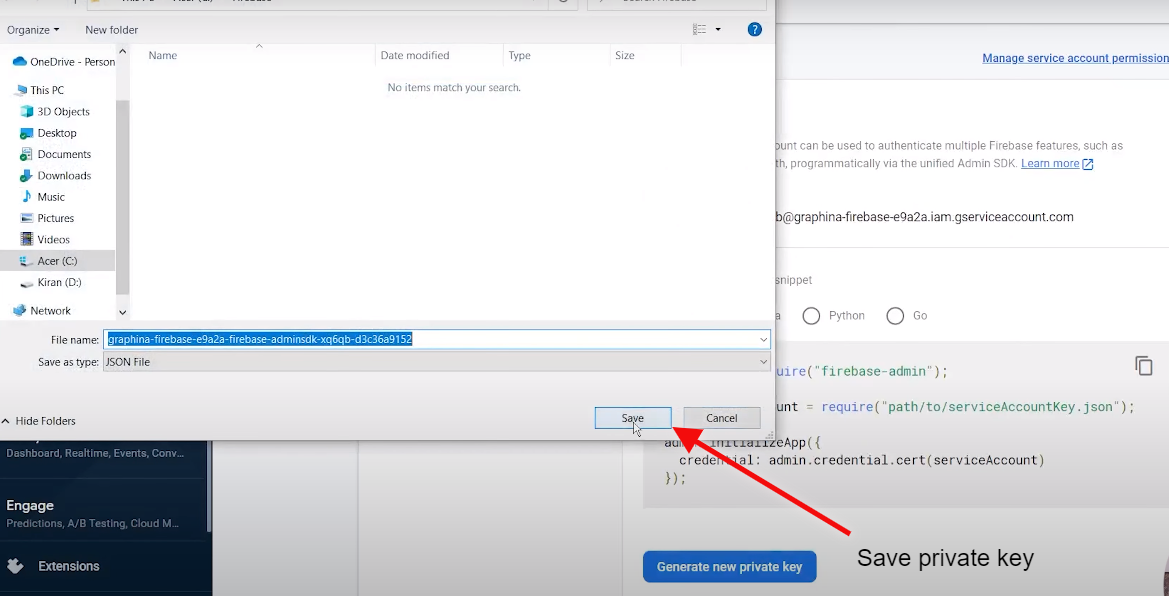
Step 11 – Click on the Generate New private link.
Step 12 – Save the downloaded private key.
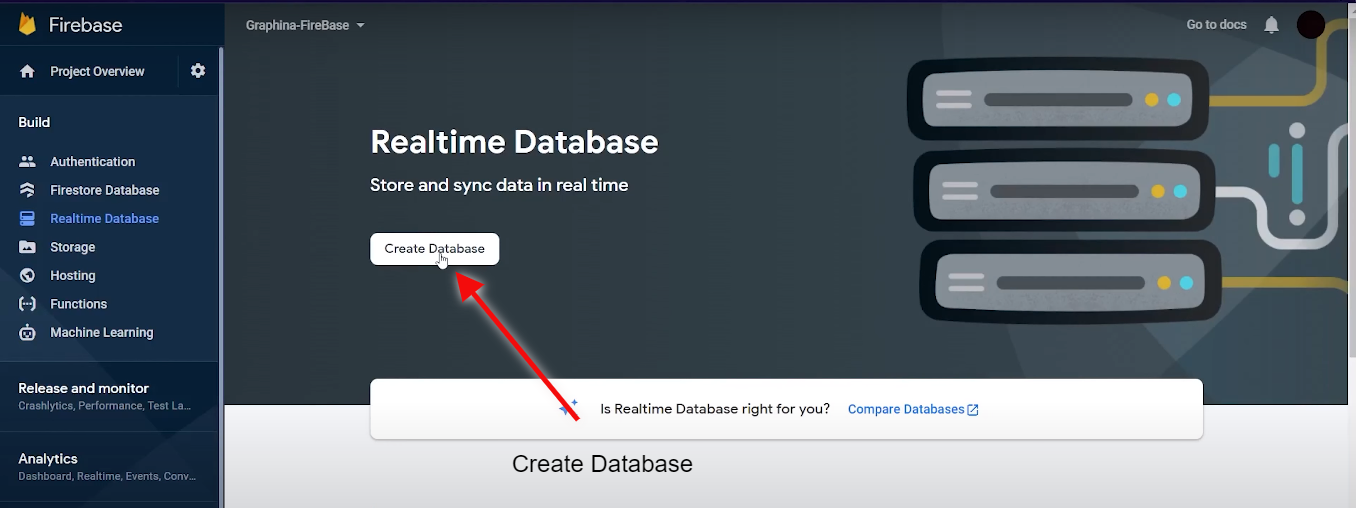
Step 13 – Then we will create the real-time database by clicking on the Real-time database and then clicking on the Create Database.
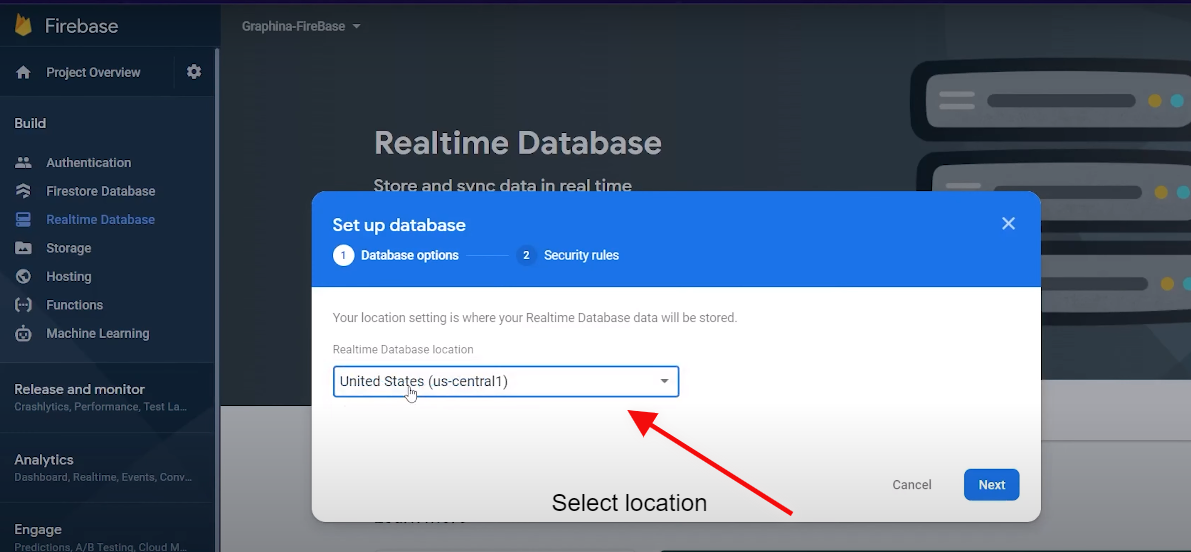
Step 14 – Select the location.
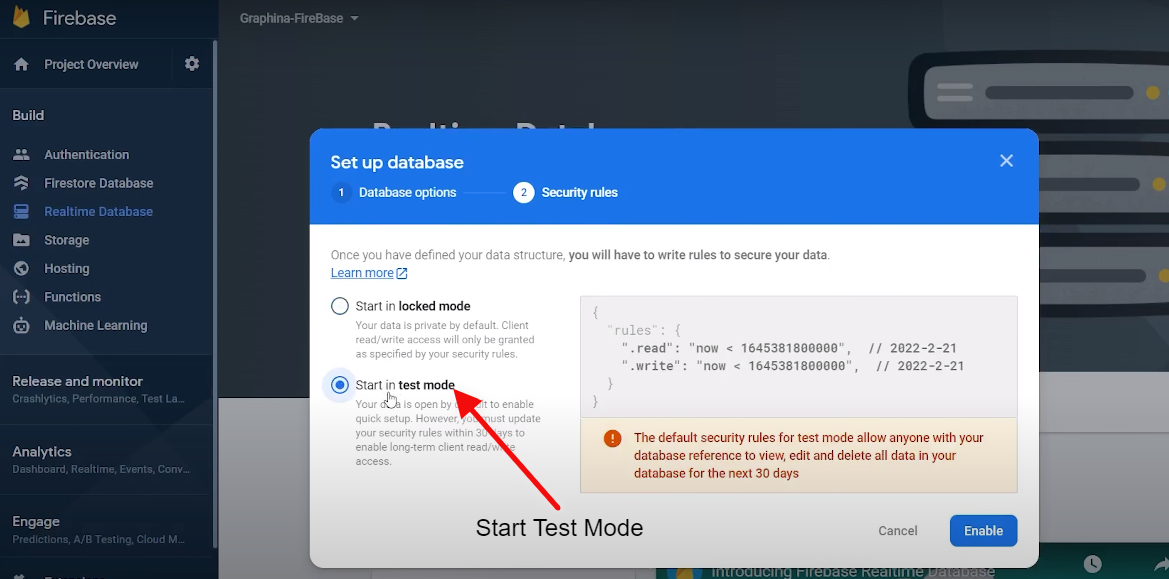
Step 15 – Choose Start with the test mode.
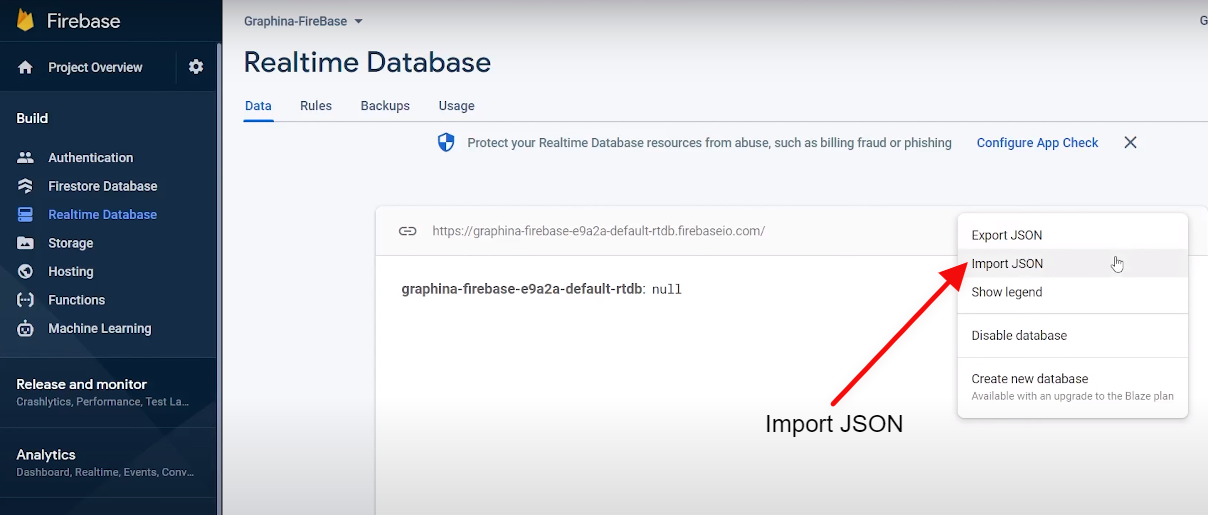
Step 16 – Then we will import the JSON.
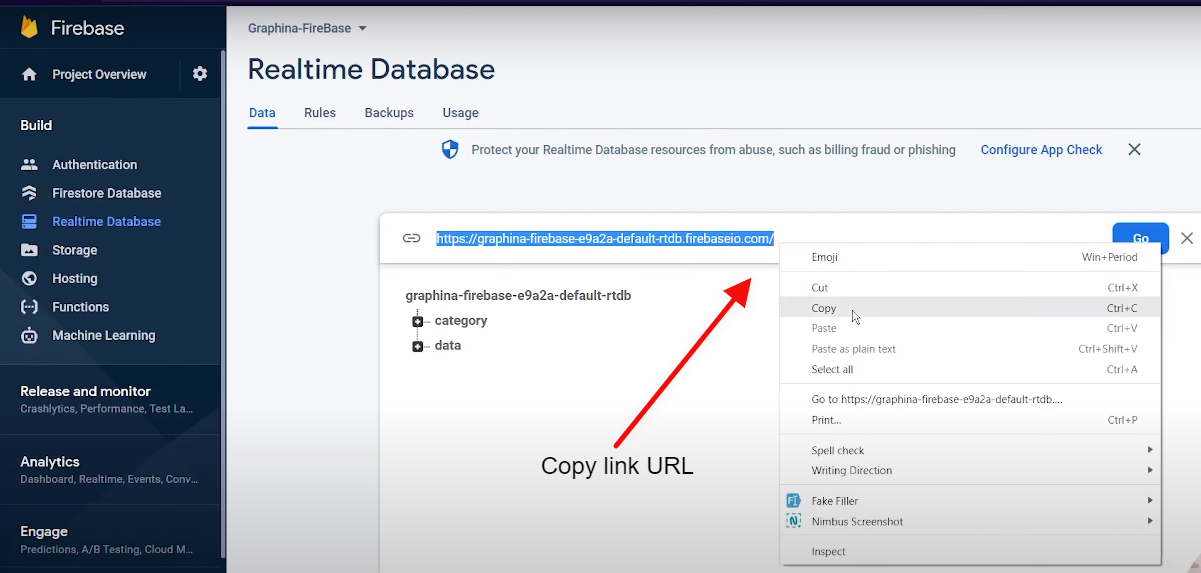
Step 17 – Now copy the generated link and paste it into the Database URL.
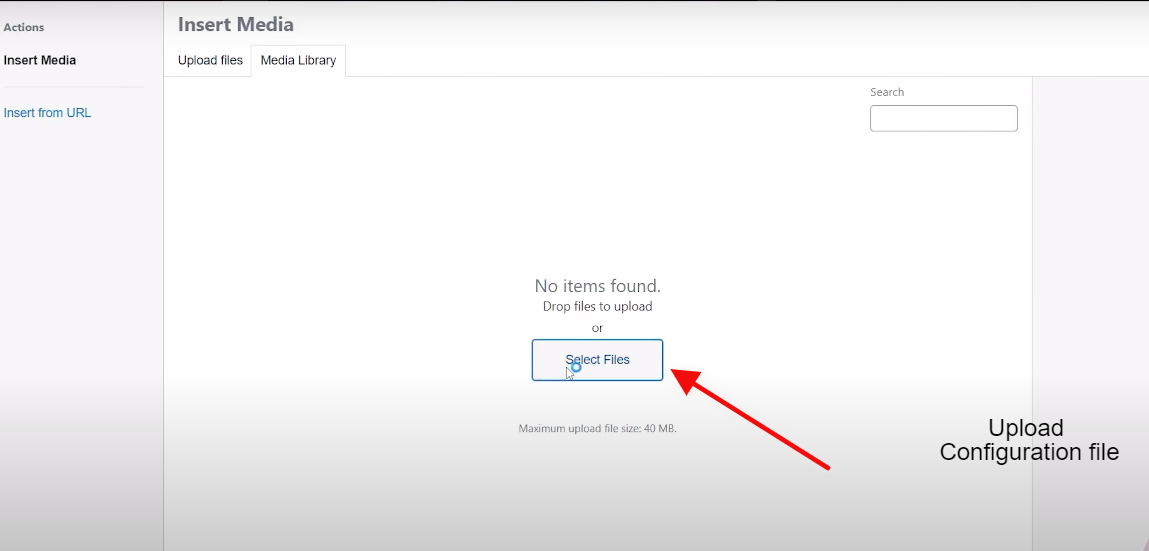
Step 18 – Upload the private key in the upload configuration file.
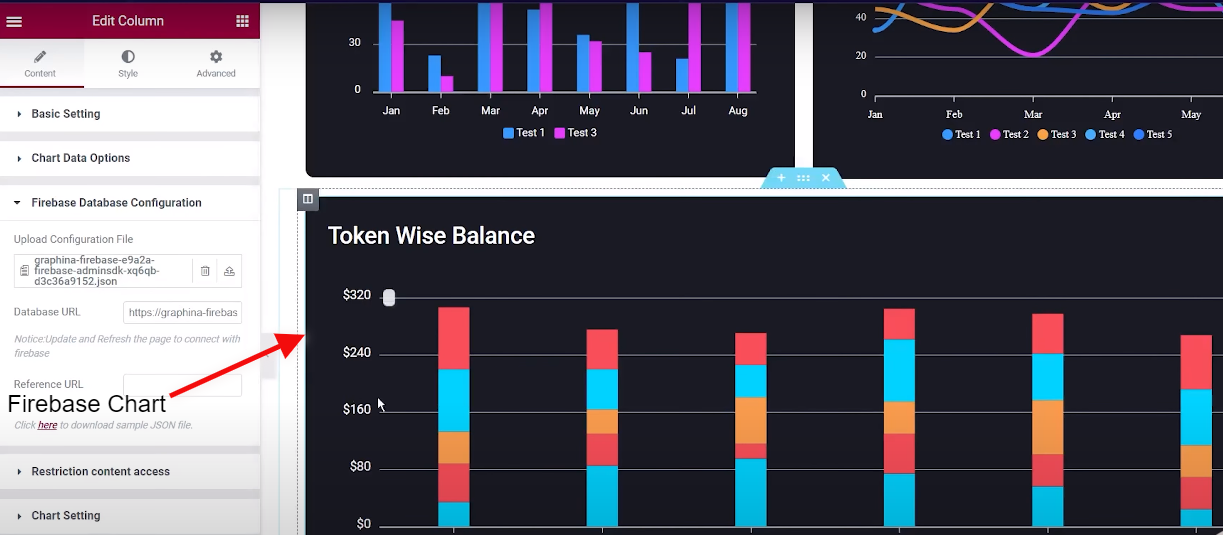
Step 19 – Once you have entered the link you will see the major changes in the chart.
That’s it for this article from this you have learned how you can add the Real-time firebase chart and graphs by using Graphina.
Click here to get your live demo of Graphina now.
Was this article helpful?
YesNo


